
FIG. 7.
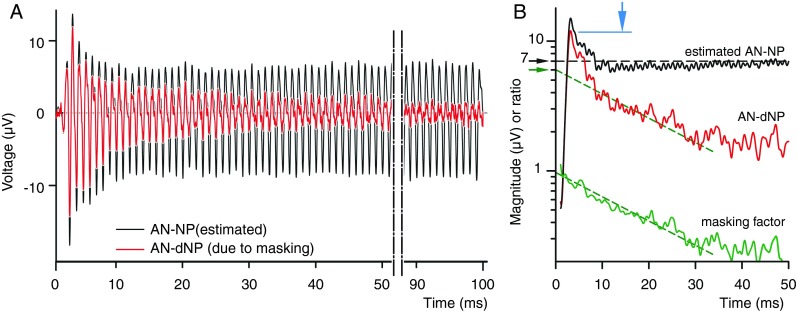
Comparison between the decaying AN-NP (red trace; only the positive polarity of the raw response is considered, same as the magenta trace in Figure 2A(d)) and the estimated AN-NP from Figure 6 (black). A Overlay in the time domain. B Magnitudes of the signals in (A) together with the masking factor of the AN-dNP induced by the exponential recovery of masking (lower green line, calculated as the ratio of the magnitudes and slightly smoothed with a noncausal moving average filter). The blue arrow is the peak-magnitude of the AN-dNP; the black arrow is the estimate of the steady-state amplitude (7 μVp); and the green arrow is the extrapolated amplitude based on the exponential recovery of masking.