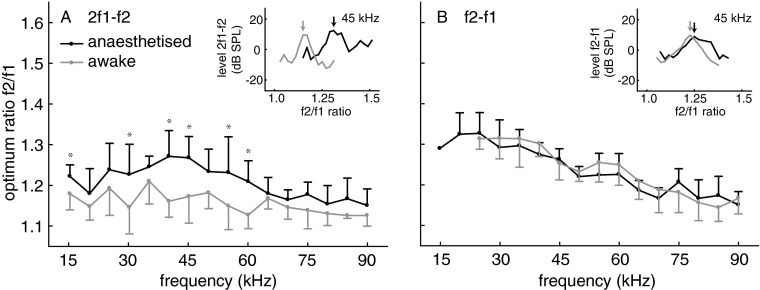
FIG. 1.
Optimum frequency ratio f2/f1 for awake (grey) and anaesthetised (black) bats at different f2 frequencies (n = 17). Error bars: absolute value of SD, shown for graphical reasons only as upward (anesthetised) or downward bar (awake). Inlays: dependence of DPOAE level on f2/f1 ratio at 45 kHz for L1/L2: 40/30 dB SPL. Arrows: DPOAE amplitude at the optimum ratio. A: 2f1–f2 DPOAE: the f2/f1 ratio is smaller for awake than for anaesthetised bats over the entire frequency range. B: f2-f1 DPOAE: the optimum f2/f1 ratio is not significantly influenced by anaesthesia. Statistical analysis: two-way ANOVA with p values adjusted for multiple comparisons according to the Bonferroni–Holm correction.

