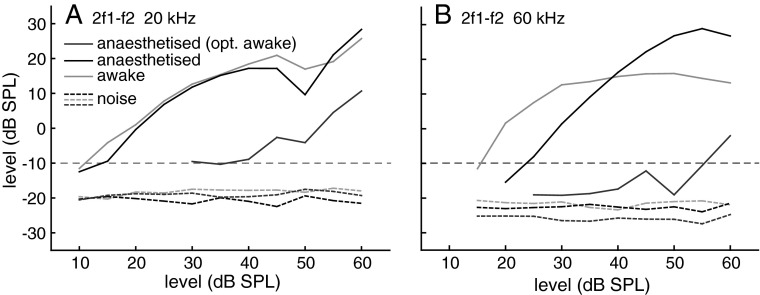
FIG. 2.
Example data from an individual bat for 2f1–f2 DPOAE growth functions at 20 and 60 kHz. Growth functions measured with the optimal ratio for the awake condition (grey) and during anaesthesia (black) are compared to a growth function obtained during anaesthesia measured with the optimal ratio for awake condition (dark grey). Dotted lines: mean noise levels + 1 standard deviation (SD) for both conditions. Horizontal line: −10 dB SPL DPOAE threshold criterion.

