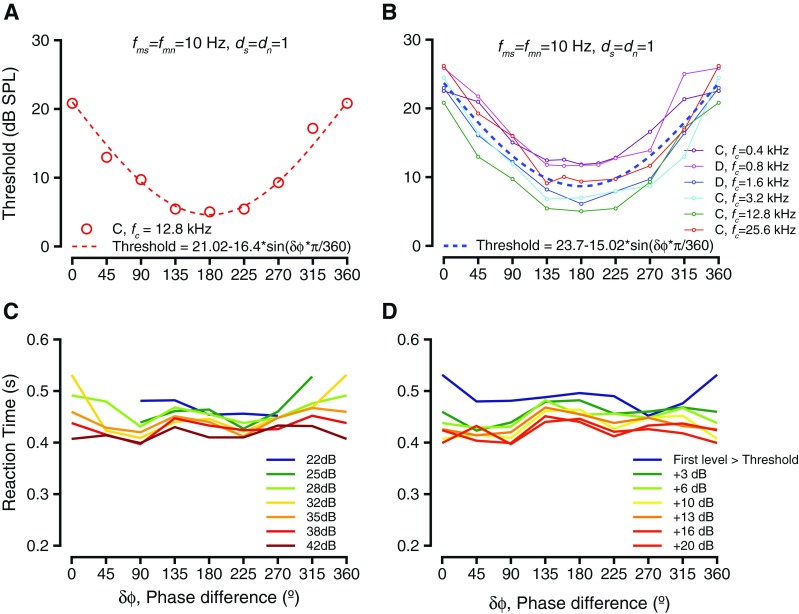
FIG. 3.

Behavioral performance as a result of varying phase difference between tone and noise modulations. A Threshold as a function of modulation phase difference for the exemplar frequency shown in Figure 1. The circles represent thresholds at the various modulation phase differences, and the dashed red line represents the best fit (sinusoid) to the threshold variations. B Threshold as a function of modulation phase difference for multiple tone frequencies tested. The individual frequencies are color-coded. Fits to individual f c values are not shown. The dashed line is the best fit to the entire data. C Trends of reaction time as a result of modulation phase difference. The lines connect median thresholds at specific sound levels. Different colors show different sound levels. D Similar to C, but levels are considered relative to threshold.
