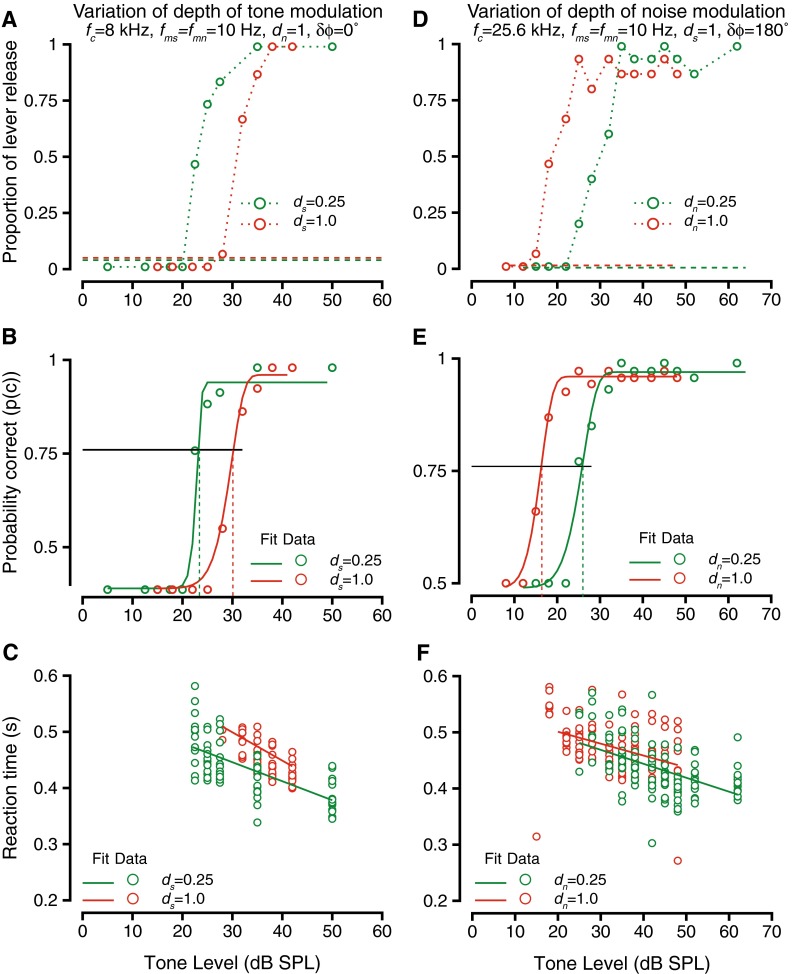
FIG. 4.

The effect of varying depth of modulation of tones (A–C) or noise (D–F) on the detection of modulated tones in modulated noise. Format is similar to Figure 2. A Hit rate vs. tone level during detection of a 8-kHz tone in broadband noise at a 55-dB overall level for two depths of tone modulation: 0.25 (green) and 1.0 (red). Tone and noise were amplitude-modulated at 10 Hz, and the modulations had a phase difference of 0 °. The depth of noise modulation was held at 1. Dashed lines show false alarm rates. B Probability correct vs. tone level for the two depths of tone modulation in A. The psychometric functions (circles) were fit with a Weibull cdf (solid lines). The horizontal line represents the threshold criterion (p(c) = 0.76), and the vertical lines represent threshold under the two conditions. C Reaction time vs. tone level during detection at the two depths of tone modulation. The reaction times (circles) relation to sound level was captured by a linear fit (solid lines). D–F Same as A–C, but hit rates (D), probability correct and thresholds (F) and reaction times (F) vs. tone level when the depth of noise modulation was manipulated. Tone frequency was 25.6 kHz, tone and noise modulation frequencies were set at 10 Hz, and noise level was 55 dB. The depth of tone modulation was held at 1.0, and the modulations had a phase difference of 180 °.
