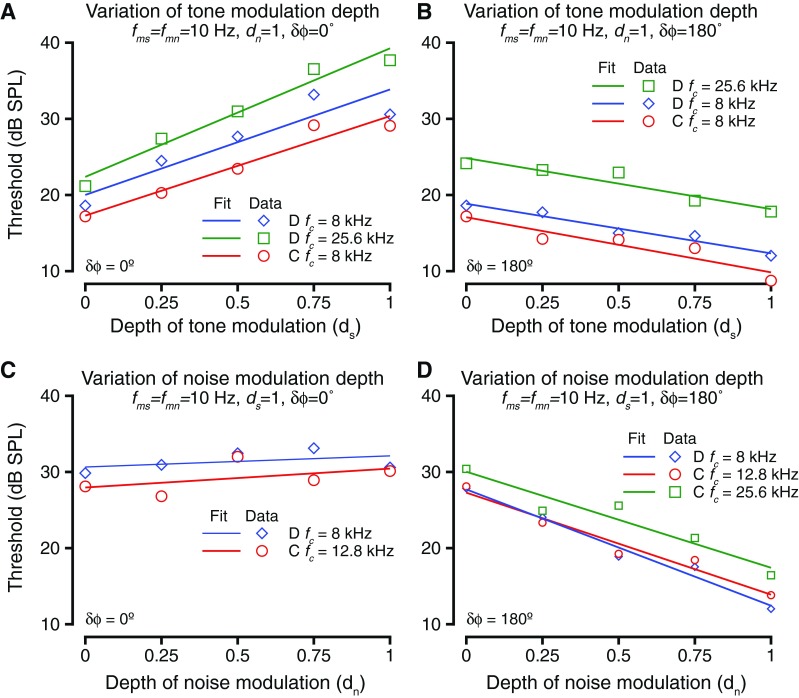
FIG. 5.

The effects of varying depths of tone and noise modulations. A Threshold as a function of change in the depth of tone modulation. Thresholds are shown for three different tone frequencies (different colors) at various depths of tone modulation. The relationship was best captured by a linear fit (solid lines). The tone and noise modulations were in phase during these blocks. B Similar to A, but for these blocks, the tone and noise modulations were anti-phase (phase difference = 180 °). C Threshold as a function of depth of noise modulation. Format is the same as in A and B. For these blocks, the tone and noise modulations were in phase. D Similar to C, but for these blocks, tone and noise modulations were anti-phase.
