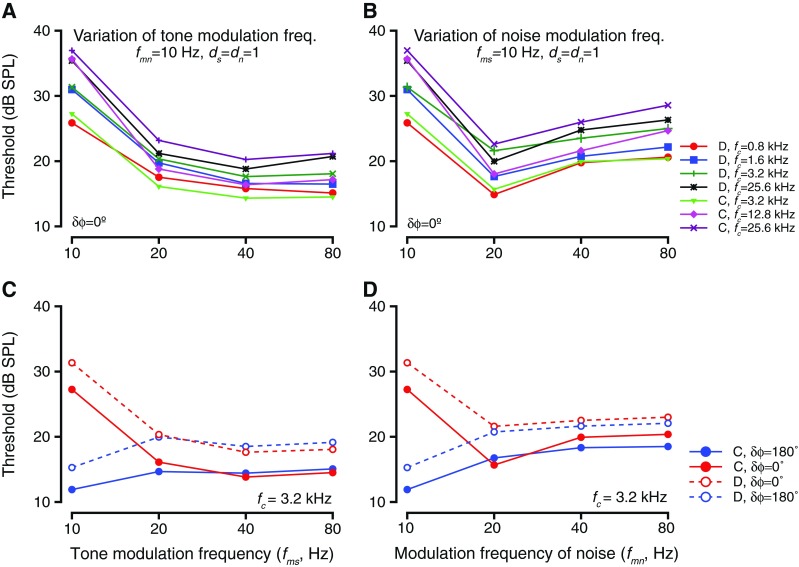
FIG. 7.

The effects of varying the frequency of tone or noise modulations. A Threshold as a function of tone modulation frequency. Thresholds for detection of tones of varying carrier frequencies (fc, different colors and symbols; legend with panel B) in modulated noise, when tone modulation frequencies were changed. The tone and noise modulation frequencies were in phase during these blocks. B Similar to A, but shows detection thresholds for tones having same fc values as in A (different colors) in modulated noise when the noise modulation frequencies were varied. C Threshold as a function of tone modulation frequency when the tone and noise modulations were in phase (red) or anti-phase (blue) at tone onset for two subjects (solid and dashed lines, respectively). The tone frequency was 3.2 kHz. D Similar to C, but for variations in frequency of noise modulation.
