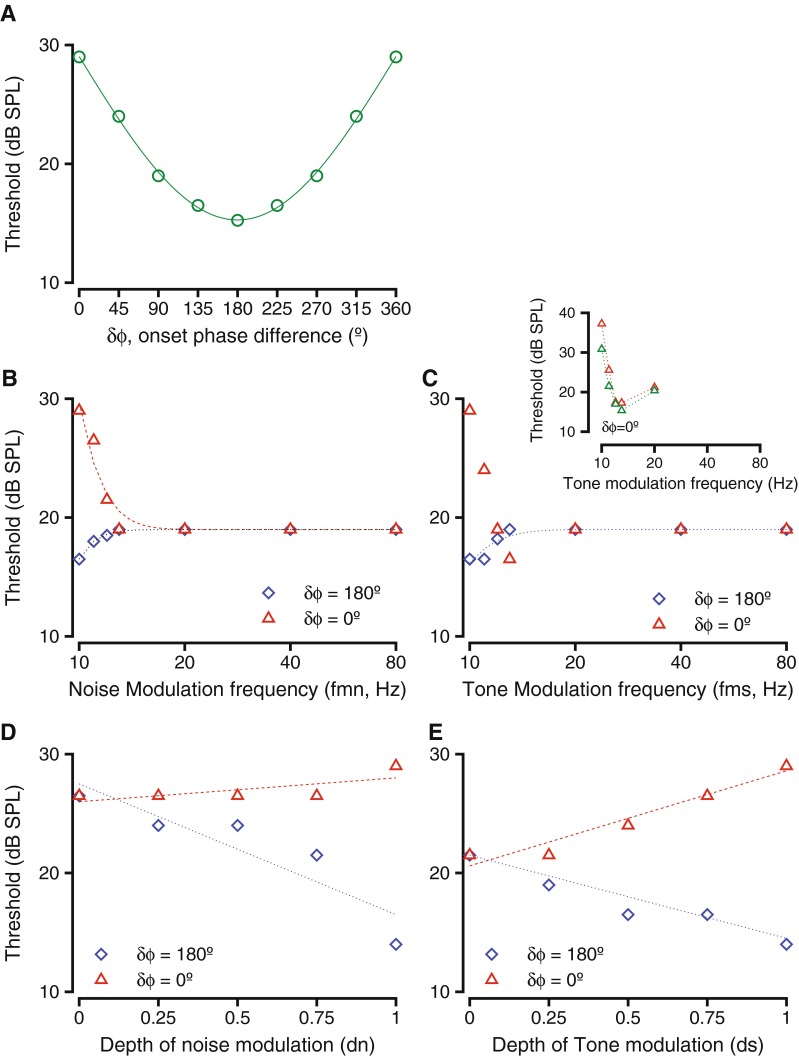
FIG. 8.

Results of a simple energy difference model that predicts variation in behavioral threshold as a result of the parameter manipulations for the studies presented here. Parameters match those used in the experiments. A Effect of varying phase difference between tone and noise modulations. Circles show thresholds, solid line represents best fit to the data. B Effect of varying frequency of noise amplitude modulation. Thresholds are shown when tone and noise modulation were in phase (red triangles) and anti-phase (blue diamonds) at tone onset. Dashed and dotted lines show best fit to the symbols (exponential functions). C Similar to B, but for variations in tone amplitude modulation frequency. Inset. The results of behavioral experiments in two monkeys testing the effects of frequency of tone modulation between 10 and 20 Hz shows an undershoot in threshold to match model predictions when tone and noise modulations were in phase at tone onset. D Effects of varying depth of noise modulation. Format is similar to C. E Similar to D, but parameter varied was depth of tone modulation.
