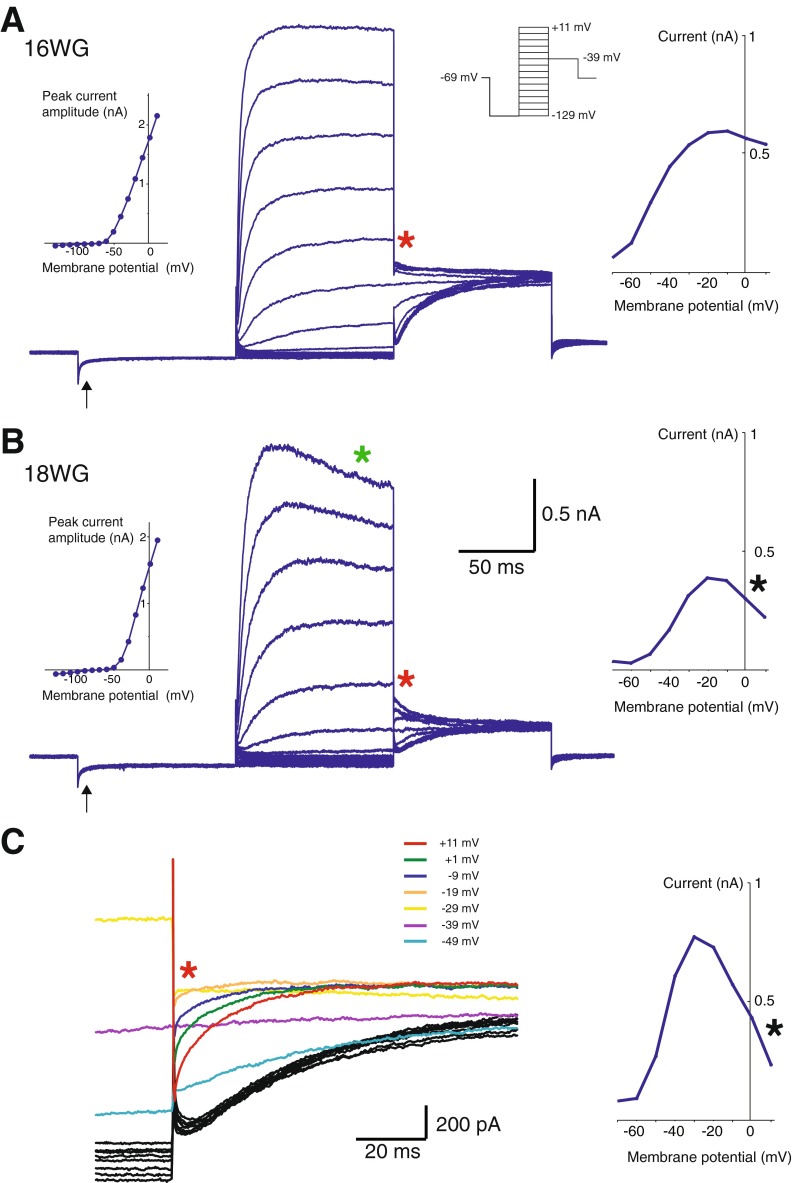
FIG. 4.
Whole-cell conductances from putative type I hair cells. A Shows whole-cell conductances from a putative type I hair cell in response to the voltage protocol (inset; right). Upon hyperpolarization to −129 mV, a presumed small G K,L conductance is evident (arrow). This type I hair cell had fast onset and non-inactivating whole-cell conductances. A peak current I–V plot was generated for this cell (inset; left). Instantaneous tail currents (red asterisk) were used to produce an activation curve (inset; right). A Boltzmann equation was used to calculate G MAX, V ½, and S values for this cell and were 11.2 nS, −47.4 mV, and 9.7, respectively. B Whole-cell conductances from another putative type I hair cell also shows the presence of a small G K,L conductance (arrow) upon hyperpolarization to −129 mV. This cell displayed a small decline or “droop” (green asterisk) in current amplitude during steady-state activation. The inset (left) shows the peak current I–V plot for this cell. The activation curve (inset; right) produced from instantaneous tail currents (red asterisk) show a distinct “collapse” of the activation curve (black asterisk). In this example, G MAX, V ½, and S values could not be calculated for this cell (see “DISCUSSION”). C Tail currents from a type I hair cell on an expanded time scale shows activation begins at ∼−49 mV and with a maximum peak current at −29 mV. At potentials more depolarized than −29 mV, the tail current reverses direction and “collapses” (black asterisk), a feature observed in embedded type I hair cells (Lim et al. 2011). The activation curve reflects this collapse and thus prevents accurate calculation of G MAX, V ½, and slope.

