
Figure 4.
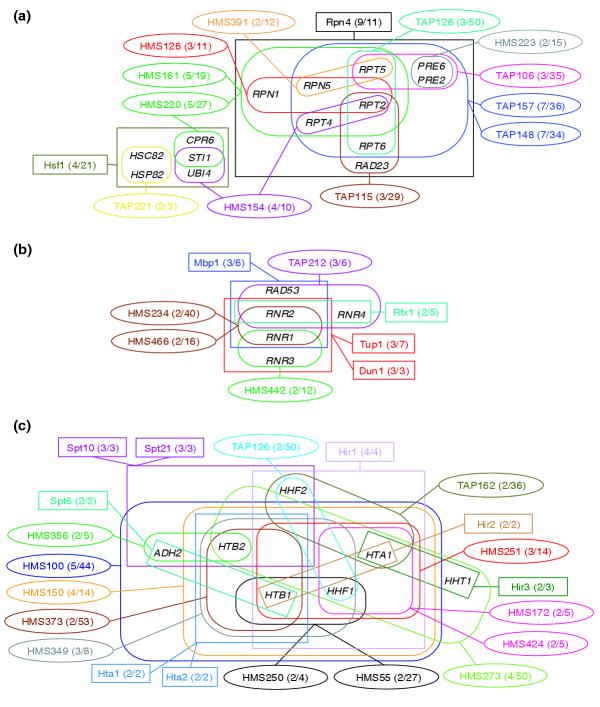
Details of three major clusters in the network linking the TAP and HMS complexes with annotated regulons (Figure 3). Individual complexes are identified by their alphanumerical code as in Figure 3 and depicted by ellipsoid frames, whereas regulons are denoted by the name of the bound transcription factor and depicted as rectangles. Individual complexes and regulons appear in different colors in a given cluster. Genes involved in complexes or regulons are enclosed by frames as in Figure 1. (a) Yeast proteasome cluster; (b) ribonucleoside diphosphate reductase cluster; (c) histone cluster.