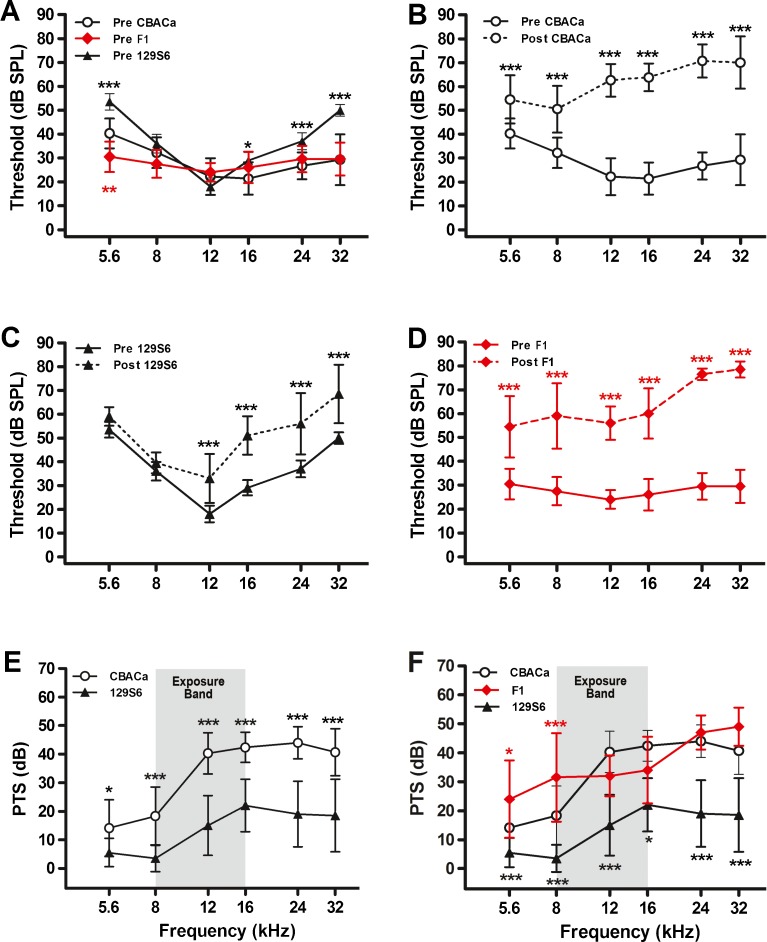
FIG. 1.
Noise resistance in CBACa versus 129S6. Pre- and postexposure ABR thresholds were measured for CBACa (n = 29), 129S6 (n = 10), and their CBACa129S6F1 hybrids (n = 10). The noise exposure band (8–16 kHz) is highlighted in gray. Data are expressed as means (+SD). Significance is indicated by asterisks: *p < 0.05, **p < 0.01, and ***p < 0.001 in a Bonferroni post hoc test following a two-way ANOVA. A Preexposure thresholds for 129S6 are elevated relative to CBACa and the F1 hybrids at several frequencies. The overall strain effect in the ANOVA is F2,276 = 49, p < 0.0001. The black and red asterisks denote p values comparing CBACa to 129S6 and CBACA to the F1 hybrids, respectively. B For CBACa, postexposure thresholds are markedly elevated across all frequencies compared to preexposure values. The overall strain effect in the ANOVA is F1,336 = 1492, p < 0.0001. C For 129S6, postexposure thresholds are elevated in the mid- and high-frequency range compared to preexposure values. The overall strain effect in the ANOVA is F1,108 = 118, p < 0.0001. D For the F1 hybrids, postexposure thresholds are markedly elevated across all frequencies compared to preexposure values. The overall strain effect in the ANOVA is F1,108 = 639, p < 0.0001. E While both strains exhibit PTS, the shift for 129S6 is dramatically less than CBACa. The overall strain effect in the ANOVA is F1,222 = 241, p < 0.0001. F PTS values are similar between CBACa and CBACa129S6F1 hybrids at most frequencies. The overall strain effect in the ANOVA is F2,276 = 145, p < 0.0001. The black and red asterisks denote p values comparing CBACa to 129S6 and CBACA to the F1 hybrids, respectively.

