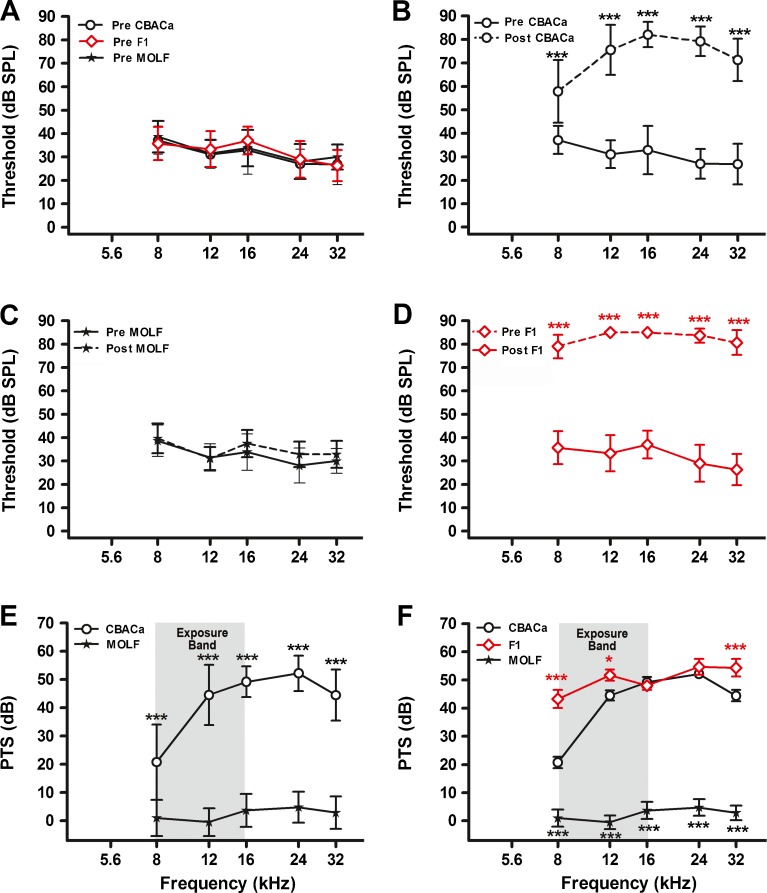
FIG. 2.
Noise resistance in CBACa versus MOLF. Pre- and postexposure ABR thresholds were measured for CBACa (preexposure group n = 50, postexposure group n = 120), MOLF (preexposure group n = 26, postexposure group n = 14), and their CBACaMOLFF1 hybrids (preexposure group n = 15, postexposure group n = 15). The noise exposure band (8–16 kHz) is highlighted in gray. Data are expressed as means (+SD). Significance is indicated by asterisks: *p < 0.05, **p < 0.01, and ***p < 0.001 in a Bonferroni post hoc test following a two-way ANOVA. A Preexposure thresholds are nearly identical between CBACa, MOLF, and the F1 hybrids. B For CBACa, postexposure thresholds are markedly elevated across all frequencies compared to preexposure values. The overall strain effect in the ANOVA is F1,840 = 3958, p < 0.0001. C For MOLF, postexposure thresholds are not significantly different from preexposure values. D For the F1 hybrids, postexposure thresholds are markedly elevated across all frequencies compared to preexposure values. The overall strain effect in the ANOVA is F1,139 = 3038, p < 0.0001. E Unlike CBACa, MOLF does not exhibit significant PTS at any test frequency. The overall strain effect in the ANOVA is F1,660 = 1205, p < 0.0001. F PTS values are similar between CBACa and CBACaMOLFF1 hybrid mice from 12–24 kHz. The overall strain effect in the ANOVA is F2,730 = 892, p < 0.0001. The black and red asterisks denote p values comparing CBACa to MOLF and CBACA to the F1 hybrids, respectively.

