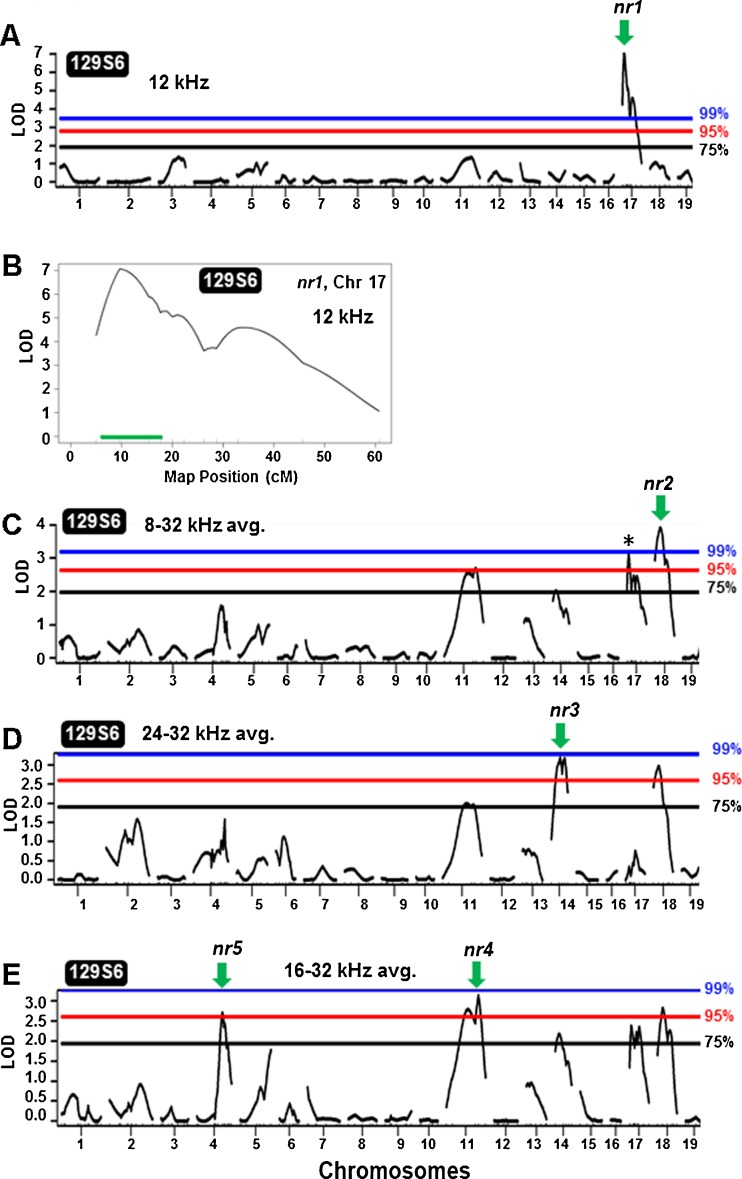
FIG. 4.
129S6 noise resistance QTL genome scans. A, C, D, and E show one-dimensional genome-wide QTL scans. The blue, red, and black bars denote the 99, 95, and 75 % permutation thresholds, respectively. The arrows indicate peak LOD curves with green-colored arrows indicating NR is associated with 129S6/129S6. A 129S6 Chr 17 contains a highly significant NR QTL peak (LOD, 7.07) using 12 kHz, designated as nr1. B The confidence interval plot for 129S6 nr1 QTL on Chr 17. The green bar represents the confidence interval for nr1. C 129S6 Chr 18 shows a NR QTL peak (LOD 3.91) using the 8, 12, 16, 24, and 32 kHz average, designated as nr2. This plot also displays the nr1 Chr 17 QTL peak with a LOD 3.13 (asterisk) reported in Table 1. D 129S6 Chr 14 shows a QTL peak (LOD 3.18, nr3) using 24 and 32 kHz. E 129S6 Chr 4 (LOD 2.71, nr5) and 129S6 Chr 11 (LOD 3.15, nr4) peak QTL were both detected using 16, 24, and 32 kHz.

