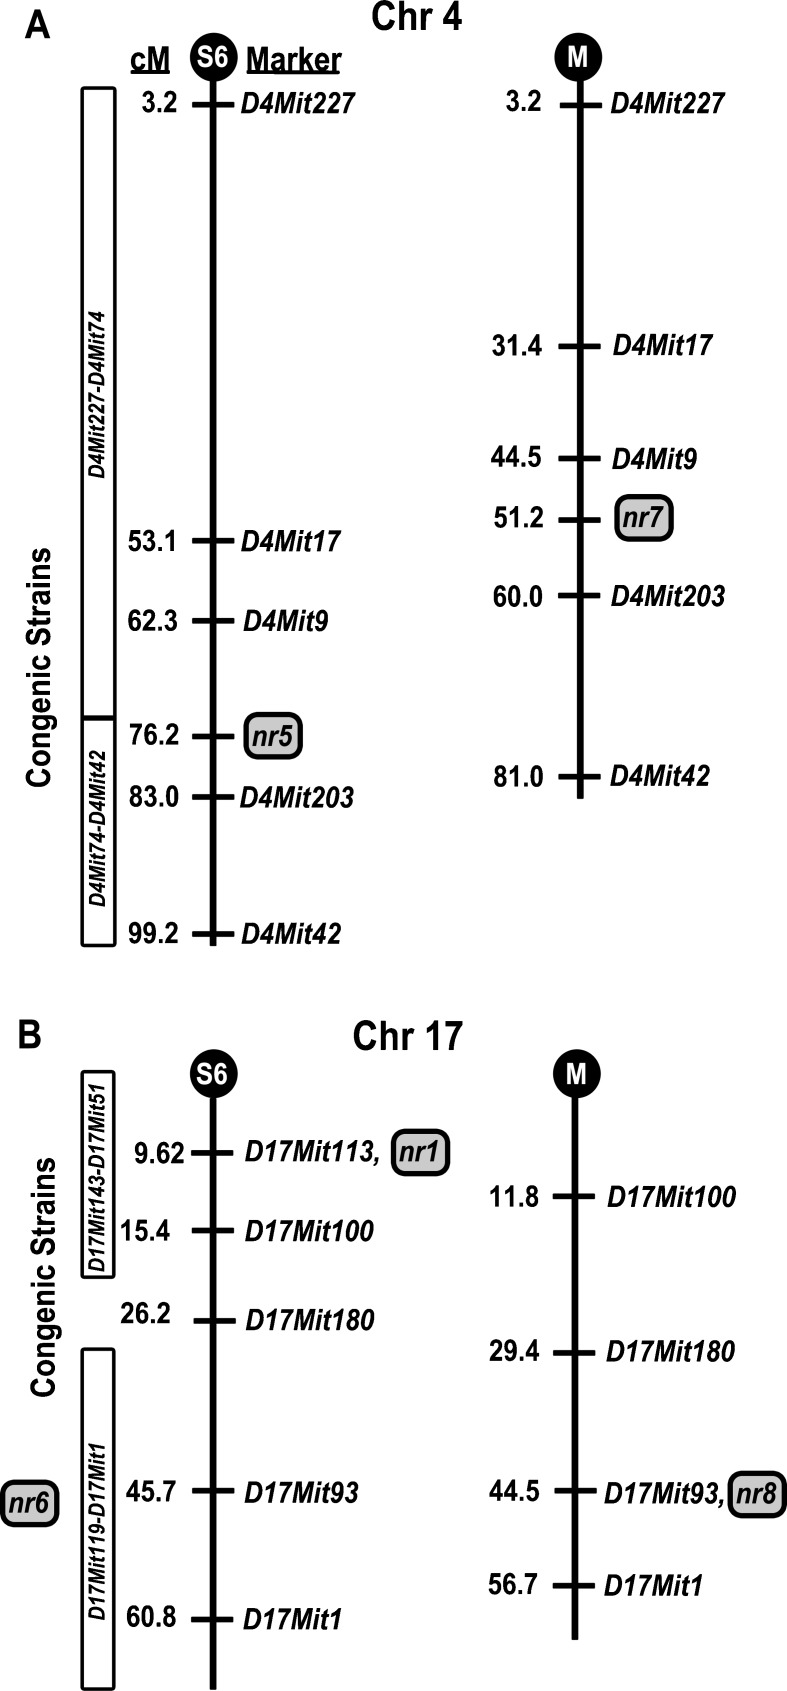
FIG. 6.
129S6 and MOLF NR loci comparison for Chr 4 and 17. Genetic maps were derived from the [(129S6 × CBACa) × 129S6] and [(MOLF × CBACa) × MOLF] crosses. The vertical line represents the chromosome with markers genotyped in both crosses to the right and the cM distance separating the markers to the left. The black circle at the top of the chromosome represents the centromere: “S6” indicates the 129S6 cross and “M” denotes the MOLF cross. The best estimates for the locations of the nr1, nr5, nr6, nr7, and nr8 QTL are shown by a gray-colored box. CBACa.129S6 congenic strains used in defining candidate NR regions are shown to the left of the 129S6 chromosome map. A Map comparison for Chr 4. B Map comparison for Chr 17.

