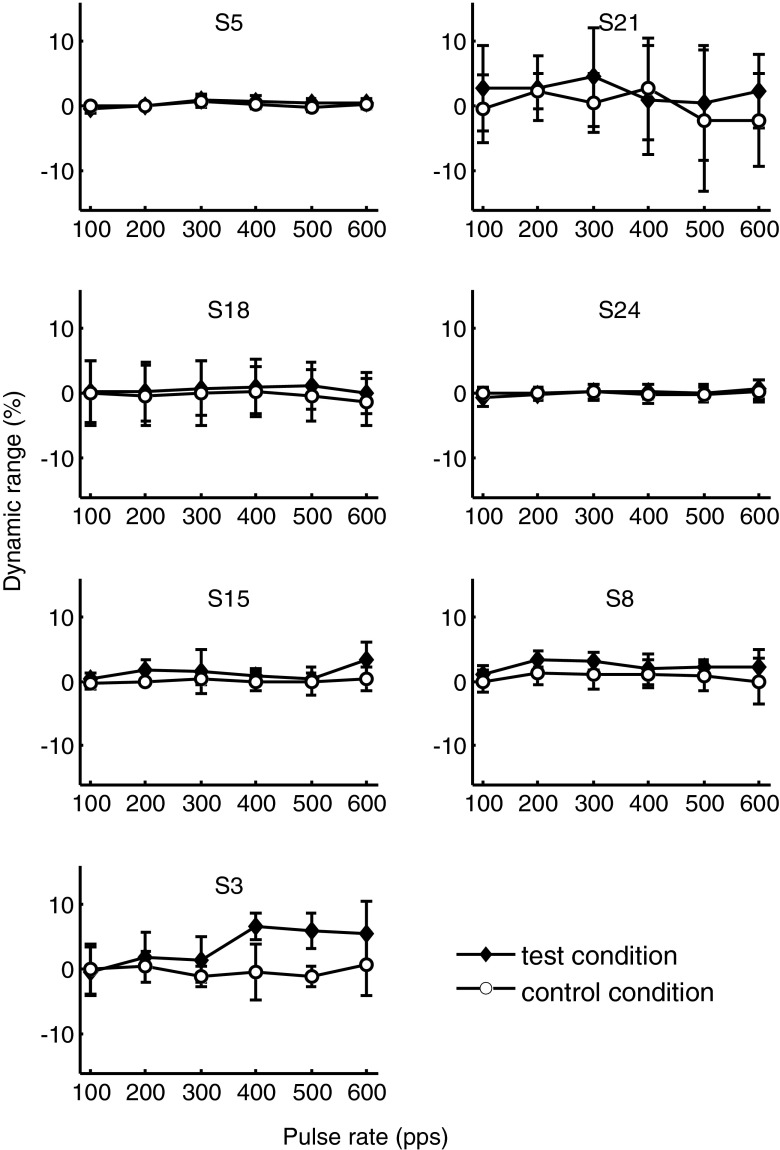
FIG. 8.
Loudness balancing data of experiment 4. Solid diamond markers indicate the average amount (arithmetic mean of eight loudness adjustments) by which loudness had to be adjusted when the reference and probe were presented at different pulse rates, and open circles show the loudness adjustments in the control condition (no difference in pulse rate between reference and probe). Error bars indicate the standard deviation of the eight repetitions.

