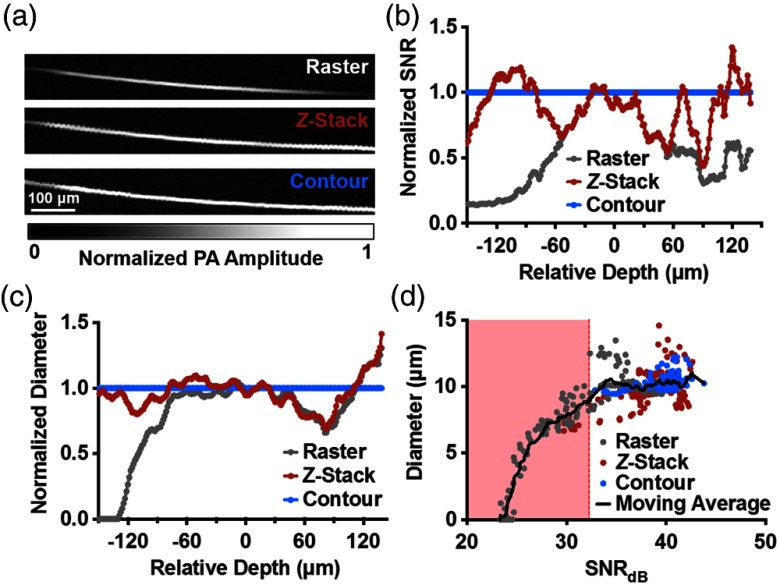
Fig. 3.
Resolution and acoustic-amplitude SNR comparison by imaging a carbon fiber. (a) Top-view maximum amplitude projection (MAP) images of the carbon fiber. (b) Acoustic-amplitude SNR and imaged fiber diameter as a function of fiber depth. (c) Imaged fiber diameter as a function of depth. (d) Diameter as a function of SNR in units of decibels.

