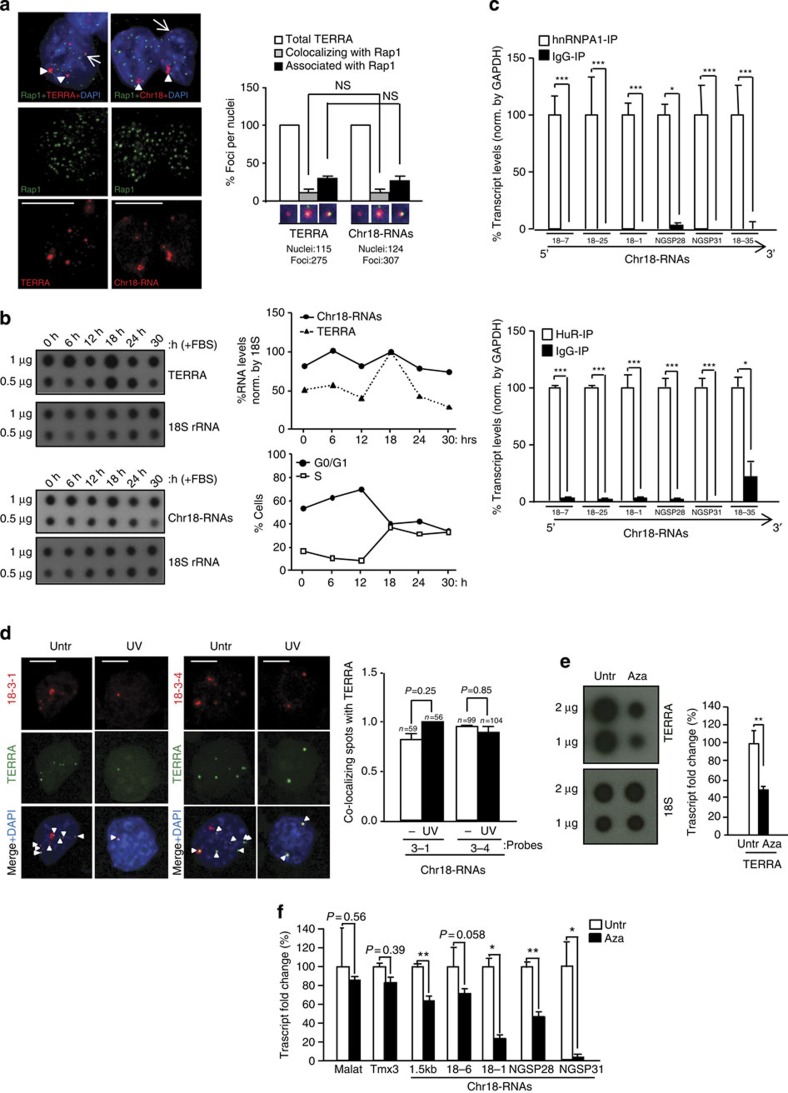
Figure 2. Transcripts arising from the subtelomere of chromosome 18 show a ‘TERRA behaviour’.
(a) Immunofluorescence to detect the telomere marker Rap1 (green) followed by RNA-FISH to detect either TERRA or chromosome 18-transcripts (red). (Graph) Percentages of Rap1 foci co-localizing/associating with TERRA or chromosome 18-RNAs per nuclei (mean±s.e.m., n=number of nuclei; three different antibodies were used for telomere detection (Rap1, TPP1 and TRF1); see the results of the other two in Supplementary Fig. 8A and B). (b) Upon pMEF synchronization, TERRA and chromosome 18-RNA levels were measured by RNA dot-blot at different time points upon serum release; 18S serves as a loading control. (Top graph) Quantification of transcripts levels normalized by 18S. (Bottom graph) Percentage of cells in G0/G1 and S phase upon serum release. (c) Immunoprecipitation (IP) assay with antibodies recognizing hnRNP A1 or HuR followed by qRT–PCR for chromosome 18-RNAs detection using primers against different regions. Glyceraldehyde 3-phosphate dehydrogenase (GAPDH) mRNA was used for normalization. Data were compared with respect an IgG-IP (mean values±s.e.m. from three different iPS clones). (d) Cells were irradiated with ultraviolet C and, upon recovery, fixed for RNA-FISH. Confocal microscopy images of double RNA-FISH using probes targeting either chromosome 18-RNAs (probes 18-3-1 and 18-3-4; red) or TERRA’s telomeric track (green) are shown. (Graph) Percentages of co-localizing foci per nuclei (mean values +s.e.m., n=number of nuclei; two different probes were used to detect chromosome 18-RNAs). (e) Upon 5′Azacytidine treatment, RNA was isolated and use for (left) TERRA detection by RNA dot-blot with a probe against the telomeric track; 18S serves as loading control. (Graph) TERRA quantification normalized by 18S (mean values±s.d., n=three replicates). (f) Quantification chromosome 18 transcripts by qRT–PCR using primers targeting different regions (mean values±s.d., n=three replicates). Tmx3 is the coding gene closest to chromosome 18 telomere and Malat1 a long-noncoding RNA located in a non-subtelomeric region. Student’s t-test was used in all statistical analysis (*P<0.05, **P<0.001 and ***P<0.0001). Total number of foci and nuclei are indicated in the corresponding panels. Arrowheads and arrows indicate co-localization and association events (partial co-localizations), respectively. Untr, untreated. Scale bar, 5 μm. NS, not significant.

