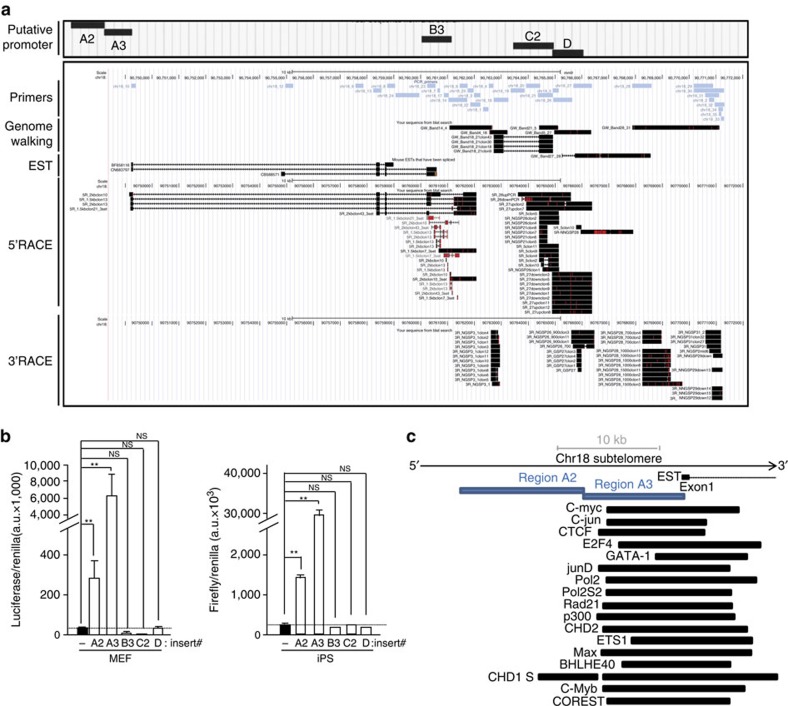
Figure 3. Identification of transcription initiation and termination sites of chromosome 18-RNAs as well as their promoter.
(a) UCSC snapshot depicting, from top to bottom, putative promoter regions (A2, A3, B3, C2 and D), genomic scale, genomic position, primer position, ‘genome walking’ transcripts, annotated mouse EST and the sequences cloned upon 5′RACE and 3′RACE experiments (RACE: Rapid Amplification of CDNA Ends; red lines indicate mismatches with respect to the reference genome). (b) The promoter-free vector pGL3 (firefly luciferase reporter system) containing the different putative promoter regions was transiently cotransfected into iPS or their parental pMEFs cells along with pGL4-Renilla (used to normalize for transfection efficiency); 48 h later, protein was extracted and used for the detection of firefly and renilla luciferase activities. Graph shows the relative fold increase in firefly luciferase activity seen in the pGL3-containing promoter regions relative to the empty vector after normalization to renilla activity. Mean values±s.d., n=3 technical replicates from one representative experiment (two independent transfections were performed in pMEFs and three in iPS; the activity of regions A2 and A3 was significant different compared with the other regions in all transfections). Student’s t-test was used for statistical analysis (*P<0.05 and **P<0.001). (c) Diagram showing, from top bottom, genomic scale, annotated EST, position of promoter regions A2 and A3 and examples of transcription factor-binding sites from ChIP data from the Stanford/Yale/ENCODE Project. NS, not significant.

