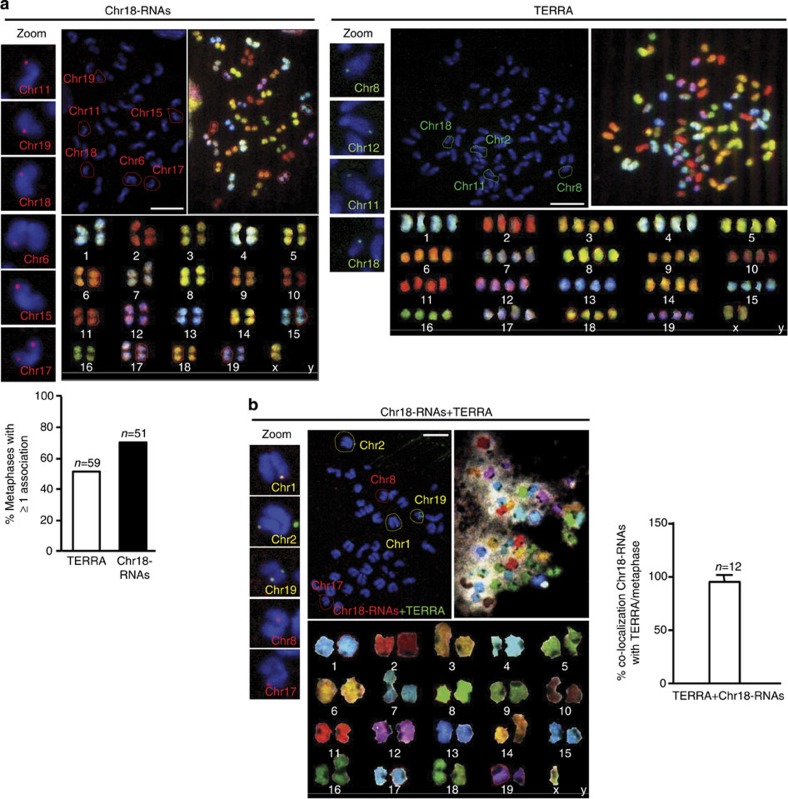
Figure 4. Identification of the chromosomes bound by chromosome 18-TERRAs.
(a) RNA-FISH with probes targeting chromosome either 18-RNAs (red) or TERRA’s telomeric track (green) or (b) with both probes (yellow) is shown: (top-middle) RNA-FISH staining in metaphases, (top-right) SKY hybridization and (bottom) chromosome identification by SKY. Those chromosomes showing probe association have been circled and identified in the RNA-FISH preparations according to the SKY information. Zoom of these associations is shown on the left. (Graph a) Percentage of metaphases showing one o more association with either TERRA or with chromosome 18-RNAs (mean±s.e.m.). n=number of metaphases analysed; three independent experiments. Scale bar, 10 μm. (Graph b) Percentage of co-localization of TERRA and chromosome 18-RNAs per metaphases. n=number of metaphases analysed; two independent experiments.

