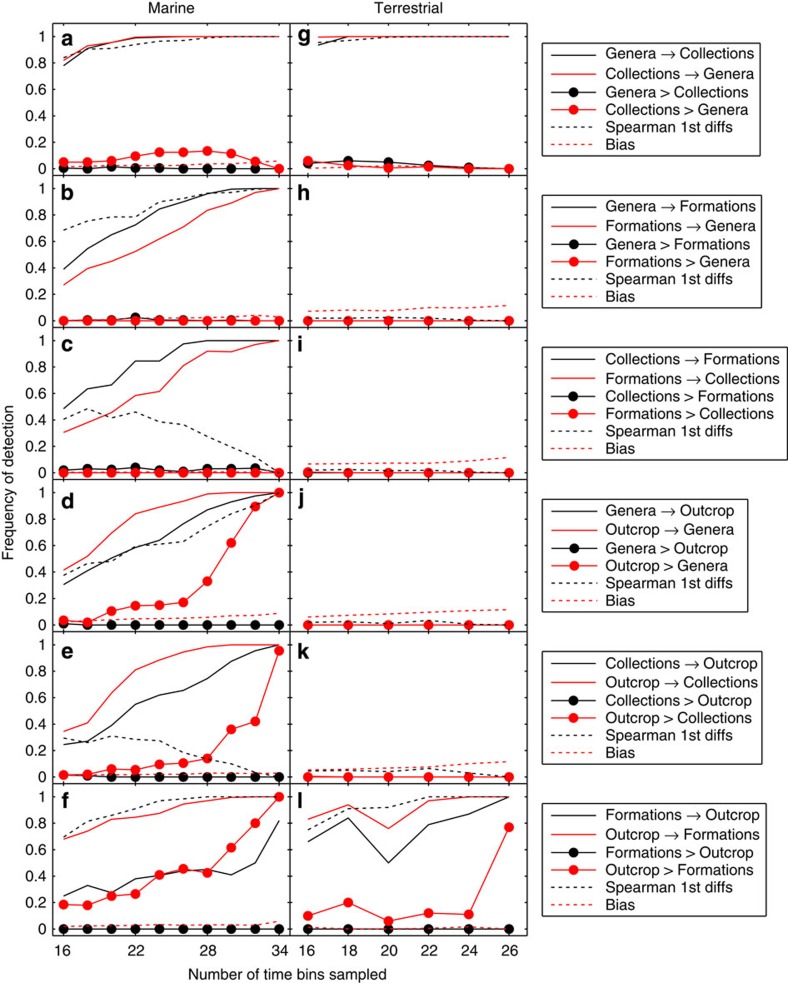
Figure 3. Directional IT and correlations between sampling proxies and palaeodiversity in the marine and terrestrial data.
Frequency of detection represents the proportion of significant results (alpha=0.01) in 500 analyses by repeated random sampling of the original time series. Detection frequency (statistical ‘sensitivity’) is evaluated as a function of the number of time bins (epochs) sampled in each iteration. For each pair of variables X and Y (indicated in the plot legend for each row of panels), solid lines correspond to significant IT in each direction (X→Y and Y→X). Filled circles correspond to a detected difference in magnitude between the two (where X>Y denotes that X→Y is significantly greater than Y→X), which represents significant asymmetry or directionality in the IT. Stippled black line corresponds to significant Spearman rank-order correlations on first differences. Stippled red line represents an index on [0,1] of potential bias due to differences in non-stationarity, where bias values of 0.1 or less are considered negligible. See text for description of the results in each panel.

