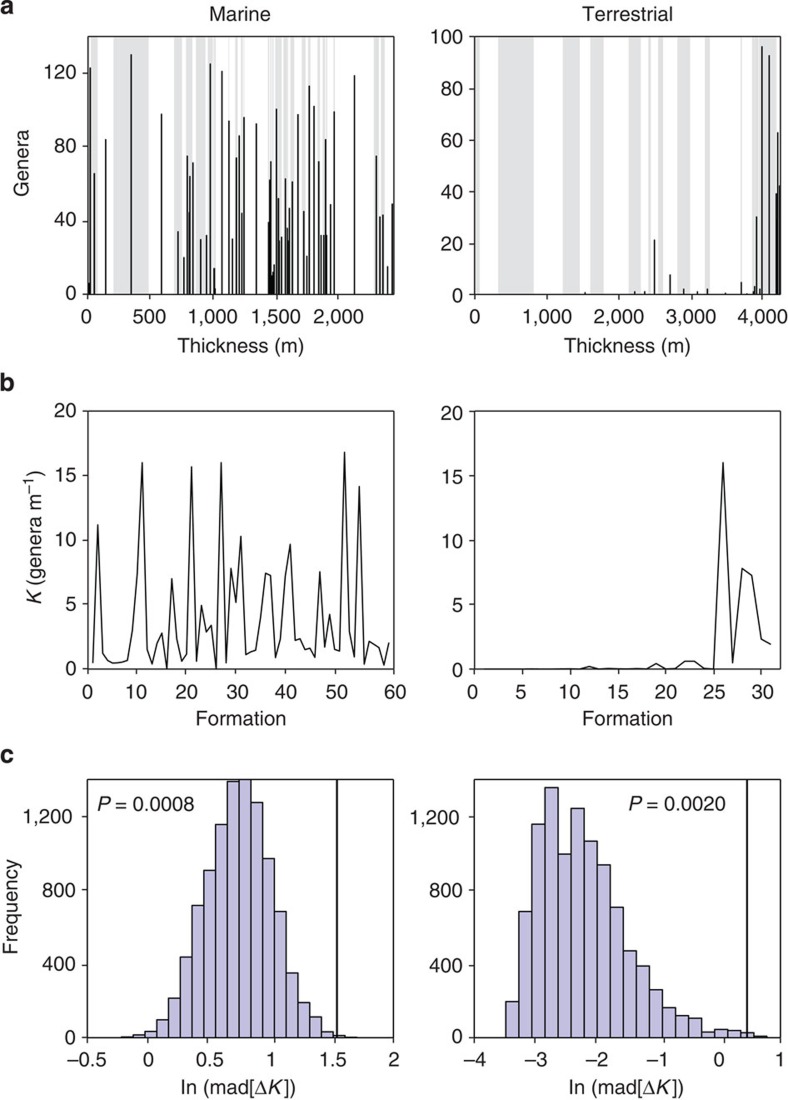
Figure 6. Testing for fossil formation independence in Triassic–Jurassic rocks.
(a) Cumulative thickness of stacked formations (alternating white/grey-shaded), with the number of reported genera (black bars) indicated at the centre of each formation. (b) Average fossil richness K (genera per m) in each formation. (c) Comparing the observed volatility of K (black line), measured as the mean absolute deviation (mad) of first differences (ΔK), against null distributions for 10,000 shuffles of K (randomly reordering the formation stack while keeping the distribution of genera fixed). P-values for the permutation test represent the proportion of values in the null distribution (histogram) that exceed the observed volatility.

