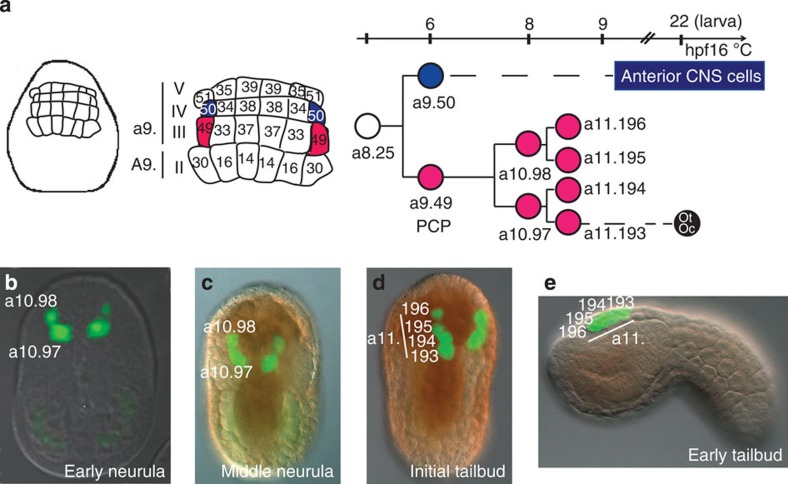
Figure 1. The Ciona neural plate and cell lineage of the PCPs.
(a, left) Schematic representations of the bilaterally symmetrical embryo at the late gastrula stage with higher magnification of neural plate scheme from row II to V; the PCP a9.49 cell pairs are indicated in pink while their sister cells (a9.50s) are in blue. (a, right) Pigmented cell lineage, right side is shown: letters and numbers indicate cell names according to the referred cell lineages. The approximate timeline applies to the diagrams and lineage tree (hpf, hours post fertilization). Cells with the same colours are derived from a single cell at the late gastrula stage; only the a11.193 cell pair (in black) differentiates into pigment cells at larval stage. Merged bright field/fluorescent images of embryos from early neurula (b) to tailbud stages (c–e) electroporated with ptyrp1/2a>2xGFP cells expressing the GFP (green) and correspond to pigment cell lineage-specific expression. Oc, ocellus, ot, otolith.

