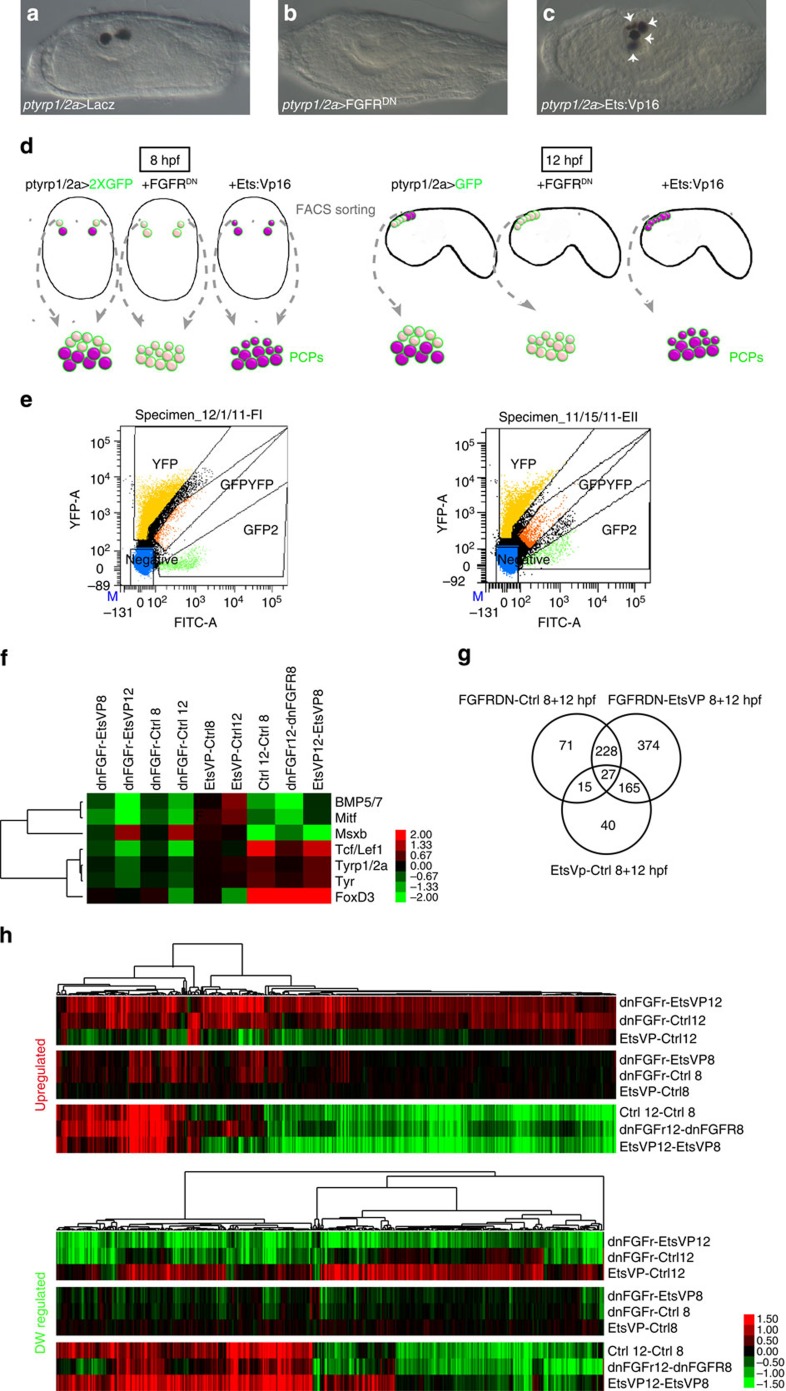
Figure 2. Pigment cell lineage-specific transcription profile.
Phenotype of larvae electroporated with ptyrp1/2a>LacZ (a), ptyrp1/2a>FGFRDN (b), ptyrp1/2a>Ets:Vp16 (c) observed with transmitted light. Lateral view, anterior is on the left. (d) Schematic representation illustrating the microarray experimental design in two developmental stages, neurula (8 hpf) and tailbud stage (12 hpf); PCPs-lineage cells for microarray analysis were sorted based on their GFP fluorescence. tyrp1/2a enhancer drives target expression of FGFRDN or Ets:Vp16 in PCPs; FGFRDN and Ets:Vp16 conditions mimic regression (light pink) or expansion (dark pink) of the pigmented cells, respectively; (e) FACS plots: ptyrp1/2a>2xGFP (8 hpf, right), ptyrp1/2a>GFP (12 hpf, left) and pMyoD>YFP-expressing cells are distinguished by their green or yellow fluorescence, respectively (hpf, hours post fertilization). The GFP-only quadrant (GFP2) was used to sort PCPs. (f) Hierarchical clustering and heat map: training data set expression values (log2 FC) consisting of known PCP markers (Ci-tyr, Ci-tyrp1/2a, Ci-Tcf/Lef, Ci-Mitf, Ci-bmp5/7, Ci-msxb and Ci-FoxD). Clustering was performed taking in account all three conditions (control, FGFRDN, Ets:Vp16) at the two developmental stages (8 and 12 hpf). Expression levels are colour coded as represented by the colour range below. (g) Identification of 912 probe sets differentially expressed when comparing the two perturbated conditions with each other and with control samples (FGFRDN versus Control, Ets:Vp16 versus Control and FGFRDN versus Ets:Vp16) at 8 and 12 hpf (for more details on transcript selection, see the text); (h) Log2FC of 912 probe sets showing an increased (upregulated) or decreased (downregulated) expressions when FGFRDN is compared with control or Ets:Vp16 conditions. Colours indicate fold change in pairwise comparisons, for example, dnFGFr-EtsVp 12, means differential expression in ptyrp1/2a>FGFRDN compared with ptyrp1/2a>Ets:VP16 samples sorted at 12 hpf; red indicate upregulation, green downregulation, respectively. See also Supplementary Fig. 1.

