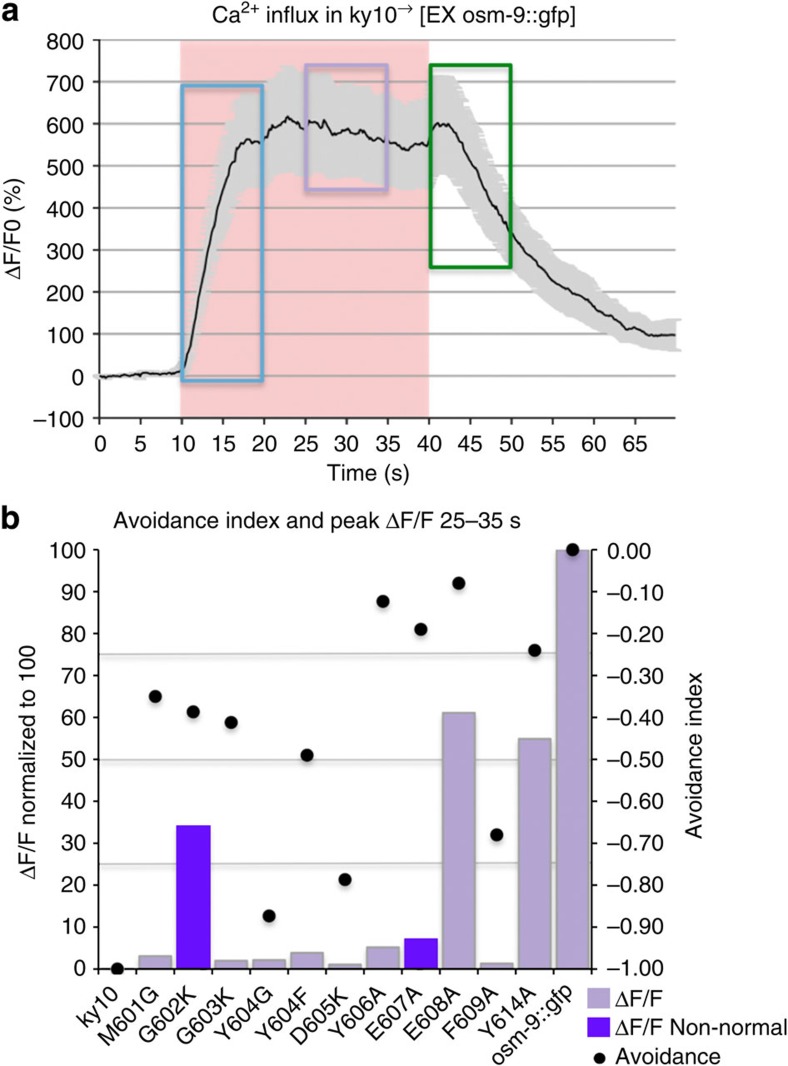
Figure 4. Summary of Ca2+ imaging and avoidance behaviour.
(a) WT Ca2+ transient obtained from OSM-9::GFP. The distinct phases of the Ca2+ transient are noted on the transient. The ON response peak is highlighted in blue, the plateau is highlighted in purple and the OFF response is highlighted in green. (b) The average peak value from the plateau period is shown, after normalization to OSM-9::GFP. Avoidance index (dots) is plotted together with average peak height of the Ca2+ transient from the plateau phase for each OSM-9 mutant. Bars in purple refer to values that were derived from averaging of non-normal data sets. Avoidance index is displayed on the right and average peak height of the Ca2+ transient is displayed on the left. Note that only two mutants, Y604G and D605K display both, defective osmotic avoidance behaviour and absence of an appreciable Ca2+ transient, thus both representing ‘dead channels’.

