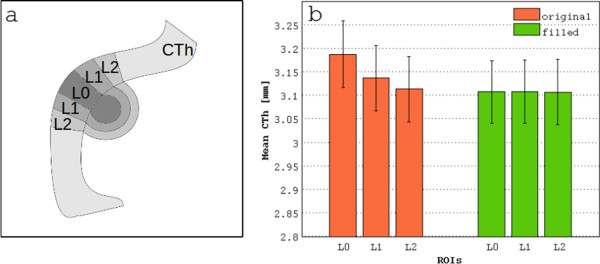
Figure 2.

Mean cortical thickness in proximity of juxtacortical lesions computed by the two analysis strategies over 6 years of follow-up in MS patients. a) Three ROIs were drawn in order to evaluate how the approach with lesion filling performs in the presence of juxtacortical lesions: L0 represents the lesion and its border, L1 includes a two voxels rim surrounding L0 and may be consider as a transition zone between lesion and normal-appearing tissue. L2 includes the two voxels rim surrounding L1 and represents normal-appearing tissue. b) mean cortical thickness (CTh) and standard error for the defined ROIs. BL: baseline; Y3: follow-up after 3 years; Y6: follow-up after 6 years.
