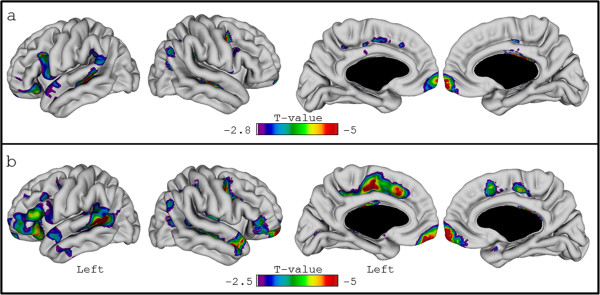
Figure 5.

Vertex-wise longitudinal analysis using the images with and without lesion filling. The figure displays the results of the vertex-wise analysis performed on original (non-filled) (a) and filled (b) images using a linear mixed model including age (at baseline), sex, disease duration (at baseline) and time points as fixed effects and patients as random effect.
