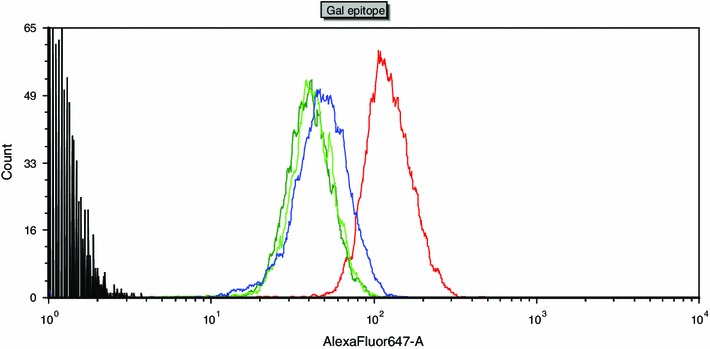
Fig. 5.

Transgene expression analysis by flow cytometry. Fibroblast derived from the following animals were analyzed: non-transgenic pig, TG588 transgenic pig expressing α1,2-fucosyltransferase, TG628 transgenic pig expressing α-galactosidase and TG632 transgenic pig expressing both α1,2-fucosyltransferase and α-galactosidase labelled by BS-IB4 lectin (detects α-Gal epitope), conjugated with AlexaFluor 647. X axis shows the fluorescence intensity, Y axis shows the number of cells, which were not labelled (black line), labelled non-transgenic cells (red line), cells from transgenic animal TG588 (blue line), cells from transgenic animal TG628 (dark-green line) and cells from transgenic animal TG632 (light-green line). The analysis showed decreased level of α-Gal antigen in transgenic animals compared to non-transgenic animals. The fluorescence fell by 60 % for the pig with α1,2-fucosyltransferase (TG588), 58.9 % for the pig with α-galactosidase expression (TG628) and 66.9 % for the pig with both α1,2-fucosyltransferase and α-galactosidase (TG632)
