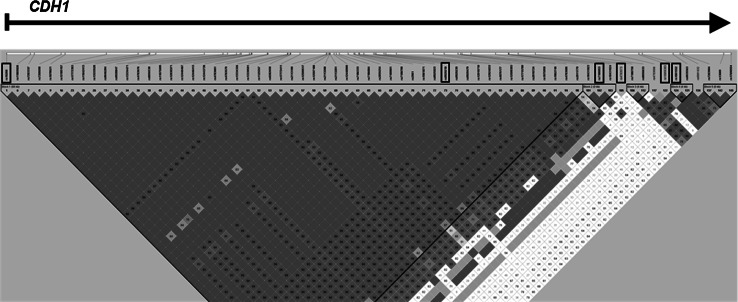
Fig. 1.
The linkage disequilibrium (LD) plot of HapMap SNPs within the CDH1 region. The plot was generated using the genotype data from HapMap CEU samples and the Haploview 4.0 software (Broad Institute, Cambridge, MA). The names of the examined SNPs are enclosed in boxes. The numbers in the squares indicate percentage of LD between a given pair of SNPs (D’ values). Blue squares are non-informative. (Color figure online)

