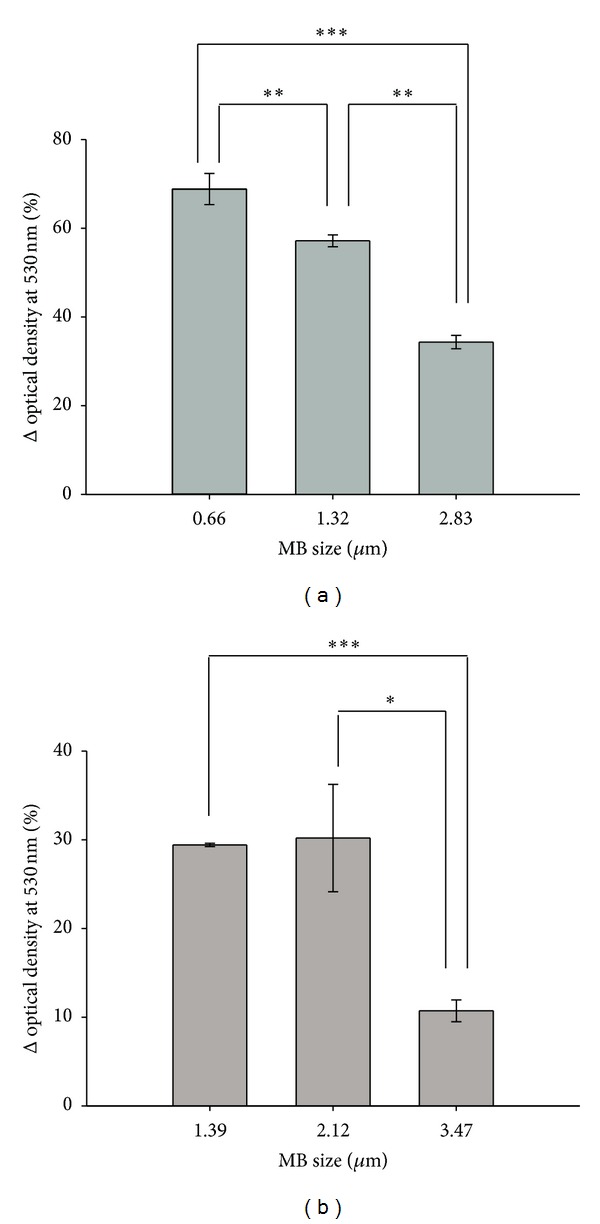
Figure 4.

Destruction efficiency for MBs of different sizes. (a) Destruction efficiencies of albumin MBs and (b) albumin/dextrose MBs of different sizes. Results are expressed as mean ± standard deviation with n = 5 for each bar. *indicates P < 0.05; **indicates P < 0.01; ***indicates P < 0.005.
