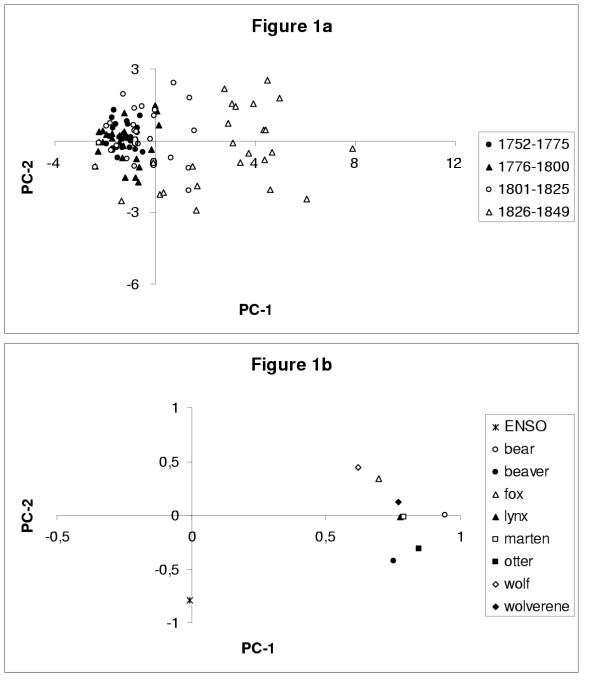
Figure 1.
Principal component (PC) analysis of the data set composed of the eight longest fur-counts and the Niño-3 sea surface temperatures (SSTs). EOF-k is the eigenvector corresponding to the kth largest eigenvalue of the covariance matrix of the data set. Each time series, whether fur count or climatic index, is centered and normalized (i.e., it has zero mean and unit variance), and the EOFs so obtained have length one. (a) Distribution of the annual values of the two leading PCs with respect to time; points are grouped by quarter-century intervals (see legend inside the figure). Note that the first half of the record (1752–1800) lies entirely within a small area in the left half-plane, and that the amplitude of the variations from one year to the next increases significantly later in the record. The results are similar when using just the eight longest fur-count records or the combination of these with either one of the other two climatic indices (not shown). (b) Correlation circle corresponding to the same PC analysis as in panel (a). The abscissa (PC-1) captures 54% of the total variance and is highly correlated with each animal-population index. The animal populations included here are bear, beaver, fox, lynx, marten, otter, wolf and wolverine. The ordinate (PC-2) captures 14% of the variance and is very well correlated (r = 0.76) with the Niño-3 SSTs; see legend in the figure for symbols.

