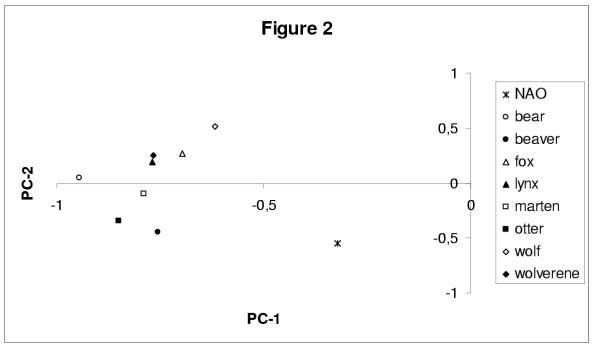
Figure 2.
Correlation circle corresponding to the PC analysis of the data set that includes the same eight fur-counts as in Figure 1, but replaces the ENSO climate index there with the NAO index here. The abscissa (PC-1) captures 55% of the total variance and is highly correlated with each one of the animal populations; same notation as in Figure 1b. The ordinate (PC-2) captures 12% of the variance and is correlated fairly well (r = 0.52) with the NAO index, but not as highly as for ENSO in Fig. 1b.

