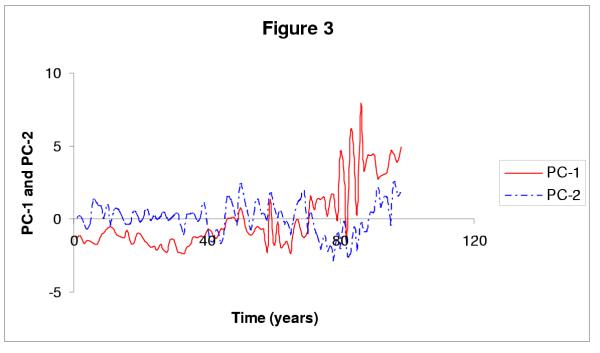
Figure 3.
Projection of the {(fur-counts) + ENSO} data set on axes 1 and 2 of the PC analysis; see legend inside the figure. Each of these two projections is then analyzed, using the SSA-MTM Toolkit, for all four data sets, to give the spectral results shown in Table 2.

