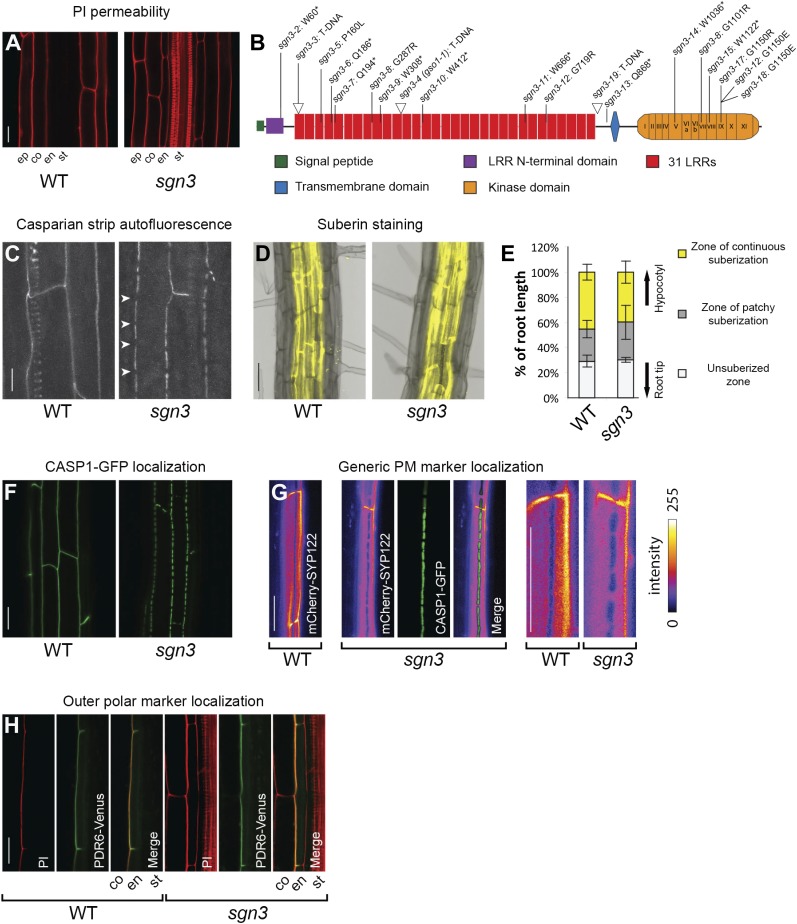
Figure 1. SGN3 receptor-like kinase is important to establish a functional endodermal barrier.
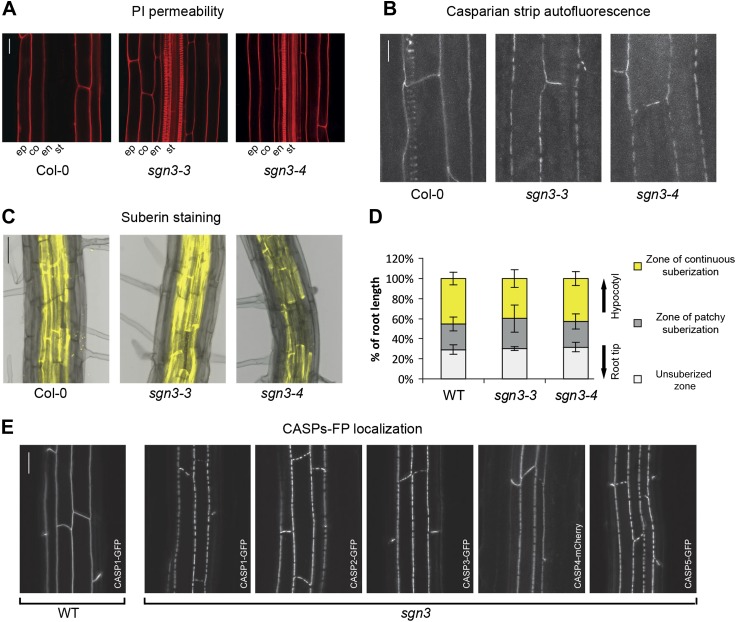
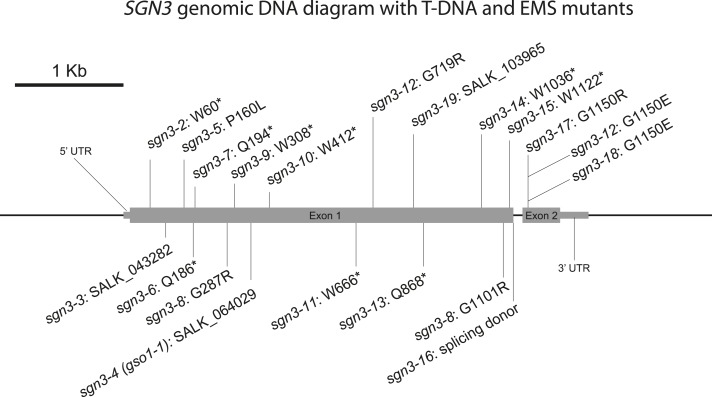
(A) Lack of endodermal diffusion barrier in sgn3-3 visualized by presence of propidium iodide (PI) in stele. (B) Diagram of the SGN3 protein showing the different domains, T-DNA insertion lines (indicated with triangles) and the ethyl methanesulfonate (EMS)-induced mutations (see also Figure 1—figure supplement 2). (C) Surface view of Casparian strip, visualized by autofluorescence after clearing. Note discontinuous lignin deposition in sgn3-3. Pictures are maximum projections of confocal z-stacks. Arrowheads indicate discontinuities in sgn3. Spiral-like signal in WT is from deeper-lying xylem vessel. (D) Fluorol yellow staining of suberin lamellae deposition in sgn3-3 and WT. Pictures are overlays of transmitted light image (gray) with fluorescent signal from suberin dye (yellow). (E) Occurrence of suberin deposition along the root is not altered in sgn3-3. Suberin lamellae deposition was quantified considering three different zones: non-suberized zone, zone of patchy suberization, and zone of continuous suberization (n = 5, one representative experiment presented). (F) Surface view of CSD network visualized with CASP1-GFP expressed under CASP1 promoter showing the net-like structure with discontinuities in sgn3-3. Projections as in C. (G) Absence of a lateral diffusion barrier in sgn3-3 visualized with plasma membrane marker line CASP1::mCherry-SYP122 (intensity color coded). Confocal pictures were taken at the surface of an endodermal cell. Note the mutually exclusive localization with the CSD marker CASP1-GFP (green). Two right images are magnification of the two leftmost images. (H) Localization of the outer marker PDR6-Venus expressed under CASP1 promoter is still polar in sgn3-3. Pictures are median longitudinal sections of endodermal cells. Scale bars: A, C, F, G, H = 20 μm; D = 50 μm. ep, epidermis; co, cortex; en, endodermis; st, stele; LRR, Leucine-rich repeat.
DOI: http://dx.doi.org/10.7554/eLife.03115.003


