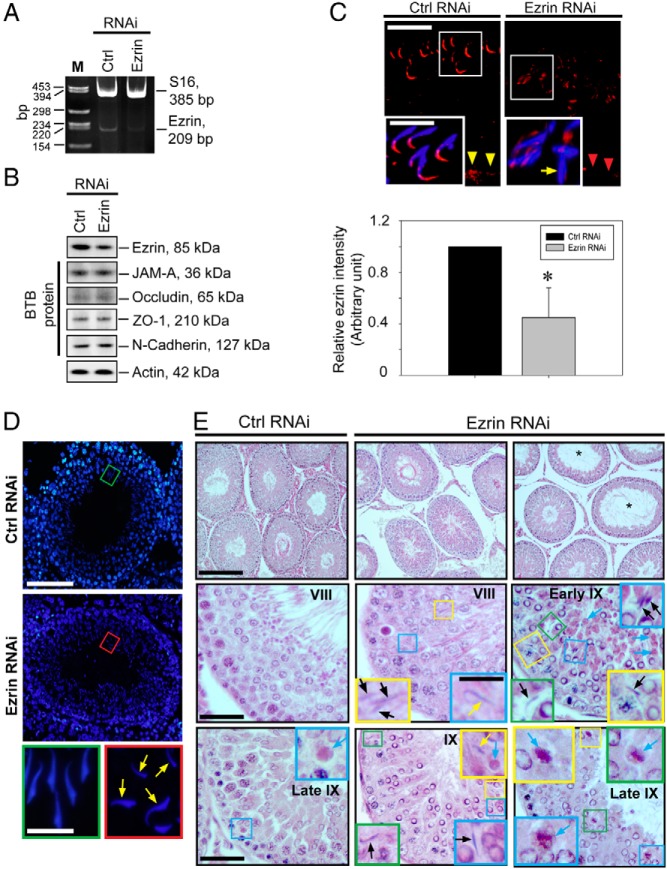
Figure 4.
A–E, Effects of ezrin knockdown on spermatid transport, spermatid polarity, and phagosome transport in the adult rat testes in vivo at stage VIII-IX of the epithelial cycle. A and B, Efficacy of the ezrin knockdown in the testis in vivo was estimated by RT-PCR (A) and immunoblotting (B). M, DNA size markers in base pairs. Data in panel B are representative findings of three experiments (see Supplemental Figure 2). C, After the knockdown of ezrin (Ezrin RNAi) vs controls (Ctrl RNAi) in vivo, the signal of ezrin (red) in the seminiferous epithelium as illustrated in this stage VIII tubule (top panel) was considerably diminished. Ezrin signal at the apical ES was mislocalized (see insets, which are enlarged images of the boxed areas). Ezrin signal at the basal ES/BTB (yellow arrowheads) was also considerably diminished (red arrowheads). Polarity of spermatids was also lost (see yellow arrow in inset). Findings are representative findings of n = 4 rats. A histogram (bottom panel) that summarizes changes in ezrin fluorescence signal in the testis in randomly selected stage VIII tubules after ezrin knockdown vs control with each bar a mean ± SD of four rats. *, P < .05. Bar, 50 μm, which applies to the other panel; bar = 25 μm in inset. D, In this representative stage VIII tubule, a loss of spermatid polarity was noted in multiple step 19 spermatids (annotated by yellow arrows) in ezrin-silenced rats. Boxed area in green or red was magnified and shown in inset. Bar, 120 μm; bar, 25 μm in inset. E, Hematoxylin and eosin staining of paraffin sections of testes. Cross-sections of representative stage VIII and IX tubules in which insets of different colors are enlarged images of the corresponding boxed and colored areas that illustrate the entrapment of step 19 spermatids in the epithelium (annotated by black arrows), spermatids with lost polarity (yellow arrows), and phagosomes that failed to be transported to the basal compartment at stage IX (blue arrows). Scale bar, 320 μm (first panel); 80 μm (middle and bottom panel); 30 μm (inset). Data shown in panels D and E are representative findings of four rats.

