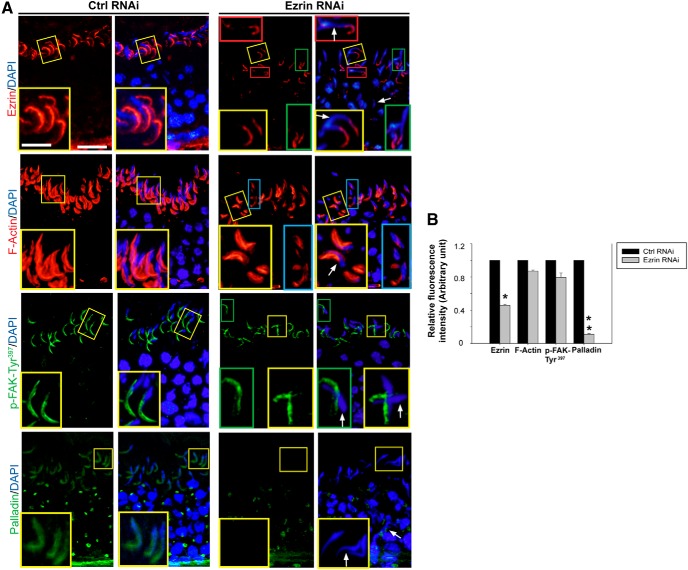
Figure 6.
A and B, A study to assess the effects of ezrin knockdown in the testis in vivo on the expression, localization, and distribution of proteins at the apical ES, impeding spermatid transport and polarity in stage VIII tubules. A, After the knockdown of ezrin in the testis in vivo, ezrin signal (red fluorescence) in stage VIII tubules as shown herein were considerably diminished, consistent with data shown in Figure 4C. Many step 19 spermatids had lost their polarity (white arrows). Although the signal for F-actin was not grossly diminished in early-stage VIII tubules after ezrin knockdown, F-actin was diminished or not found in some step 19 spermatids (blue inset). p-FAK-Tyr397, the activated/phosphorylated form of FAK known to confer spermatid adhesion, thereby regulating spermatid transport and also polarity (39), was found to be mildly, but not statistically significantly, diminished (see panel B). However, p-FAK-Tyr397 was found to be mislocalized because it was no longer tightly restricted to the tip of the spermatid head as noted in control testes; instead, it moved away from the spermatid head (see green and yellow insets), and misoriented spermatids were annotated (white arrows). Palladin, an actin-bundling protein at the apical ES, was considerably diminished; this thus impeded the organization of the actin filament bundles at the apical ES, perturbing spermatid polarity (white arrow). It is noted that there were mild differences in DAPI intensity in ezrin-silenced testes vs control in the palladin panel, but such differences could not account for the approximately 8-fold reduction in palladin expression. Insets are enlarged images of the corresponding colored/boxed area. Scale bar, 50 μm (applies to other micrographs); scale bar in inset, 20 μm, which applies to other insets. Data are representative findings of three experiments. B, Image analysis of fluorescence signals shown in panel A. Each bar is a mean ± SD of four rats. *, P < .05; **, P < .01.

