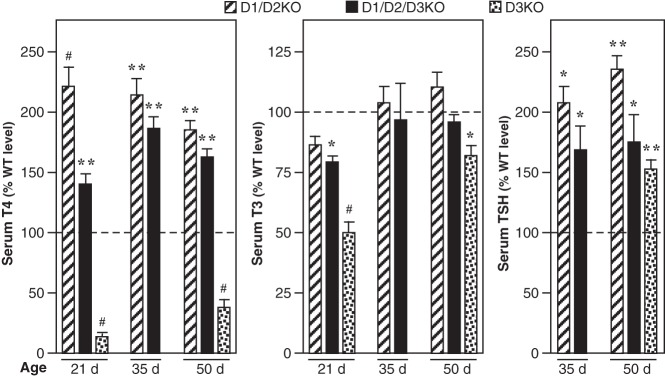
Figure 2.

Serum T4, T3, and TSH levels in D1/D2KO, D1/D2/D3KO, and D3KO mice at 21 or 35 and 50 days of age. The D3KO data are included for the purpose of comparison and have been published previously (12). The D3K0 mice are in the 129/Sv background. Values obtained in the mutant mice are expressed as a percentage of the mean value obtained in the corresponding WT mice. Bars represent the mean ± SEM of results obtained in at least four mice/group at P21 and at least eight mice/group at P35 and P50. Statistically significant differences from the WT mice are indicated: *, P < .05; **, P < .01; #, P < .001.
