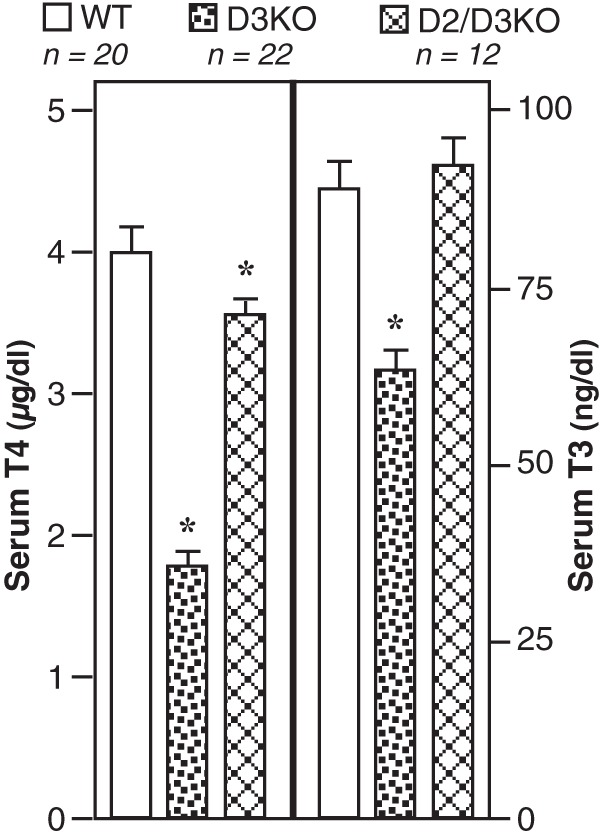
Figure 3.

Serum T4 and T3 levels in WT (C57BL/6 and 129/Sv), D3KO (129/Sv), and D2/D3KO (C57BL/6) mice. Bars represent the mean ± SEM. *, Value in mutant mice is significantly different from that in WT mice (P < .01). NB, no significant differences were observed between values obtained in WT(129/Sv) and WR(C57BL/6) mice.
