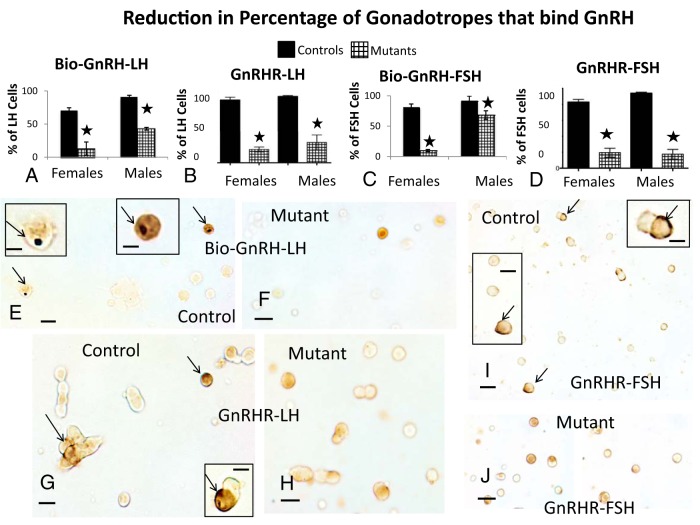
Figure 8.
Expression of GnRH-binding sites in mutants. Counts of LH cells labeled for biotinylated GnRH-binding sites show more severe reductions in binding by LH cells (A) and FSH cells (C) of mutant females, when compared with mutant males. There are also 77%–78% reductions in the percentage of LH or FSH gonadotropes with GnRHR immunoreactivity in mutants (P < .0001, n = 6, ANOVA, Tukey's) (B or D). E and G, Dual-labeling for Bio-GnRH and LH in control (E) or mutant (F) females. The insets in E depict the control cells indicated by arrows, which show the black patch of label for Bio-GnRH and the orange label for LH. No black labeling is seen in the field from the mutant (F). G–J, Dual-labeling for GnRHR immunoreactivity (black, arrows) and LH (G, control; H, mutant) or FSH (I, control; J, mutant) in female populations. The immunoreactivity for GnRHR is peripheral (arrows) and cytoplasmic and sometimes difficult to show all of it in 1 focal plane. G and I, Arrows point to control cells that are depicted in the insets. Scale bars, 20 μm (E–J) and 10 μm (insets).

