
Figure 5.
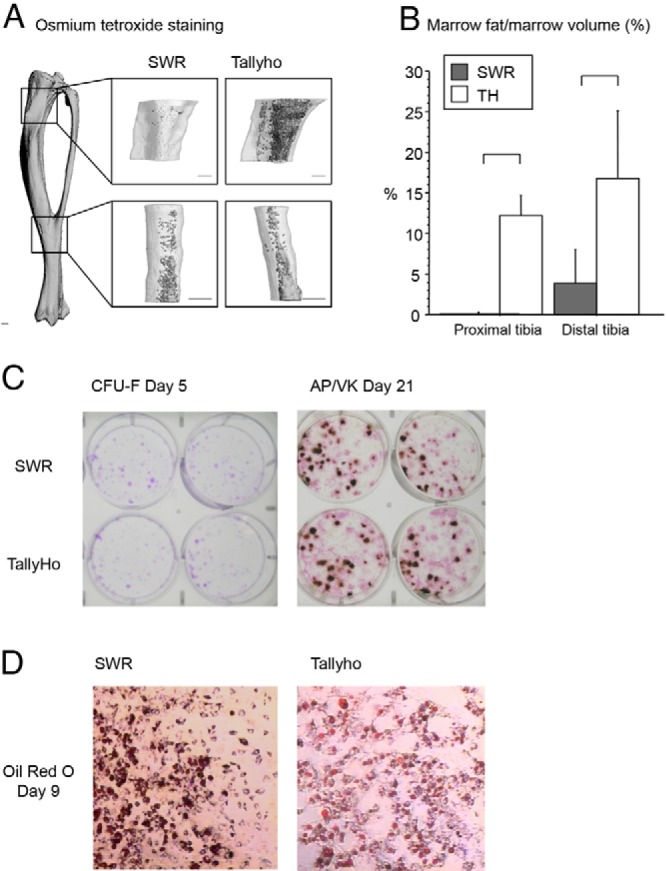
A, Osmium tetroxide staining of the tibia showed high marrow fat per marrow volume in Tallyho at 8 weeks of age. Staining was quantified in a region beginning 1 mm below the proximal growth plate (top images) and a region distal to the inferior tibiofibular joint (bottom images). Scale bars, 0.5 mm. B, Quantification of stained cells confirmed high marrow fat/marrow volume (percentage) in TH vs SWR in both the proximal and distal tibia (P < .05 for both). C, Primary bone marrow stromal cell proliferation and differentiation to the osteoblast lineage was not different between SWR and TH mice. Primary bone marrow stromal cells were plated at a density of 1 × 10⁶ cells/cm2 in six-well plates and maintained in growth medium until day 7, when they were changed to osteoblast differentiation medium. CFU-Fs were assessed with crystal violet stain on day 5. On day 21, cells were stained for alkaline phosphatase and for mineral with Von Kossa stain to address osteoblast differentiation and function. Results are representative of one experiment (performed in duplicate). D, Adipogenic differentiation from primary bone marrow stromal cells was not different between SWR and TH mice. Primary bone marrow stromal cells were plated at a density of 1 × 10⁶ cells/cm2 in six-well plates and maintained in growth medium until confluent, when they were changed to adipocyte differentiation media. Cells were fixed and stained for lipid droplets with Oil Red O on day 9 of adipocyte differentiation. Results are representative of one experiment (performed in duplicate).