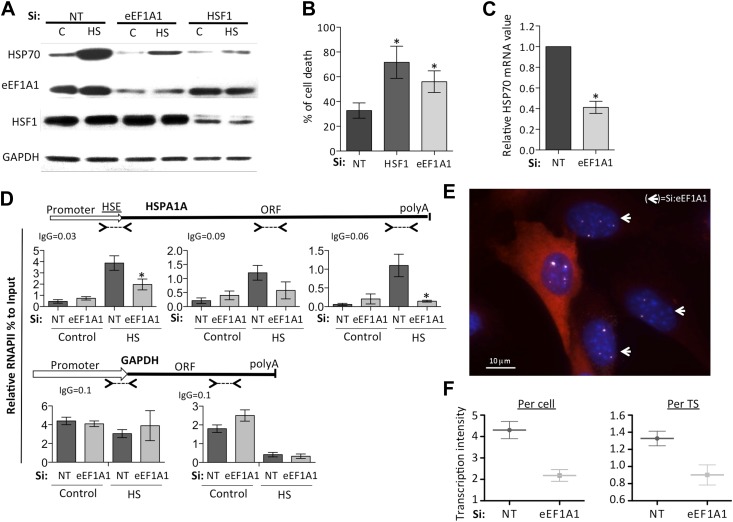
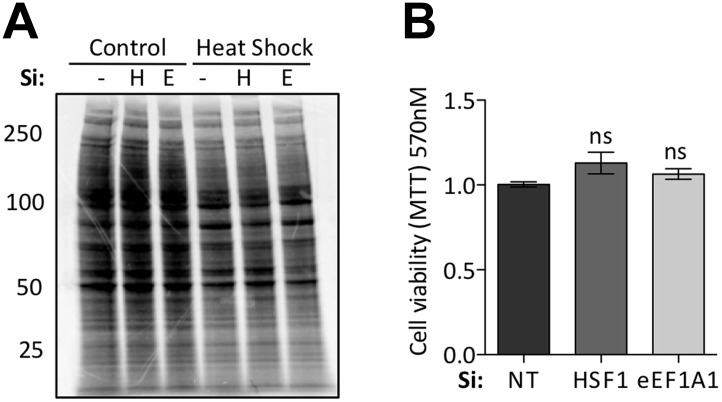
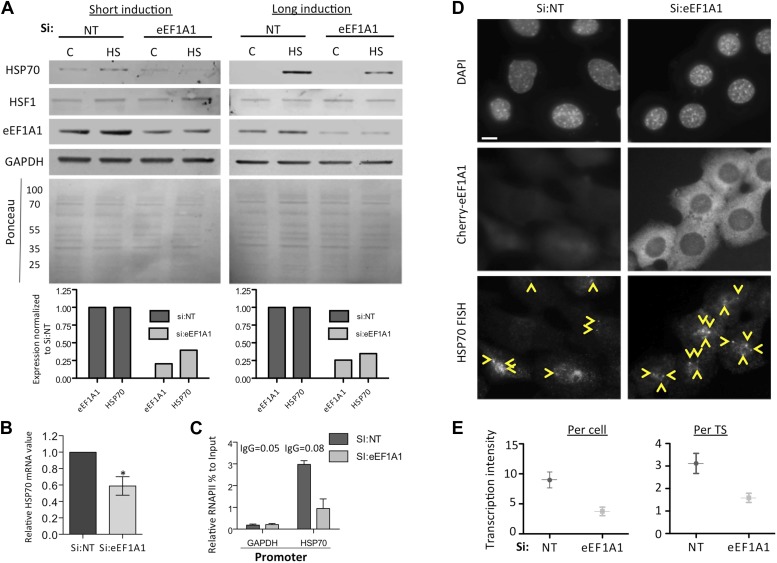
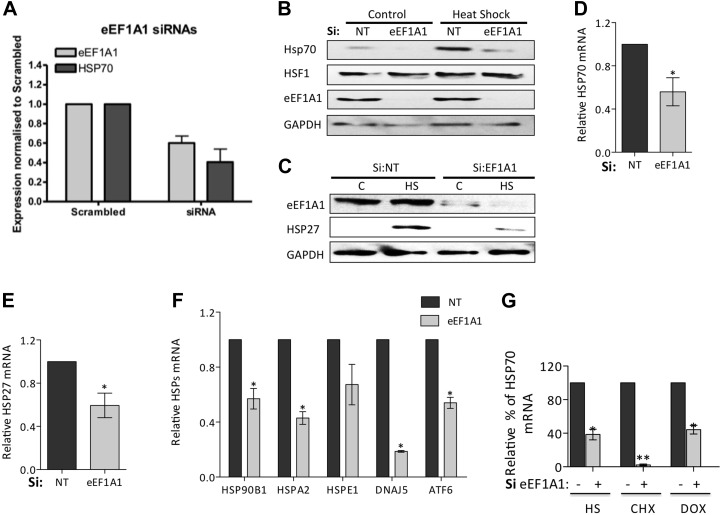
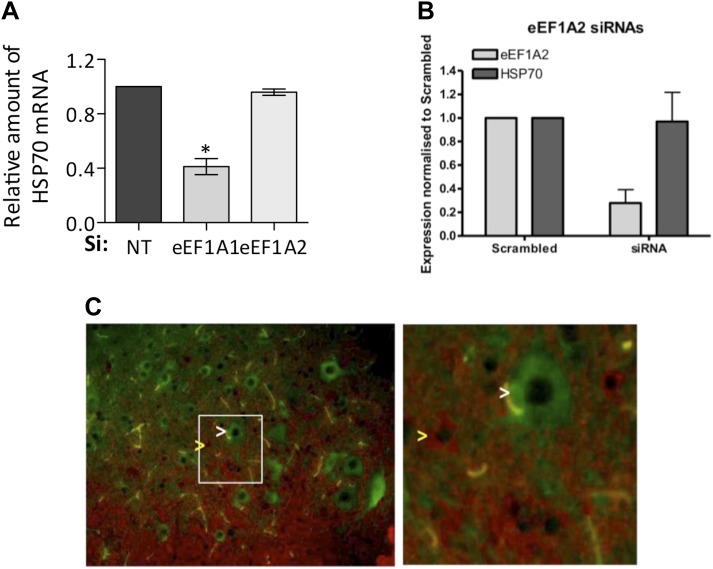
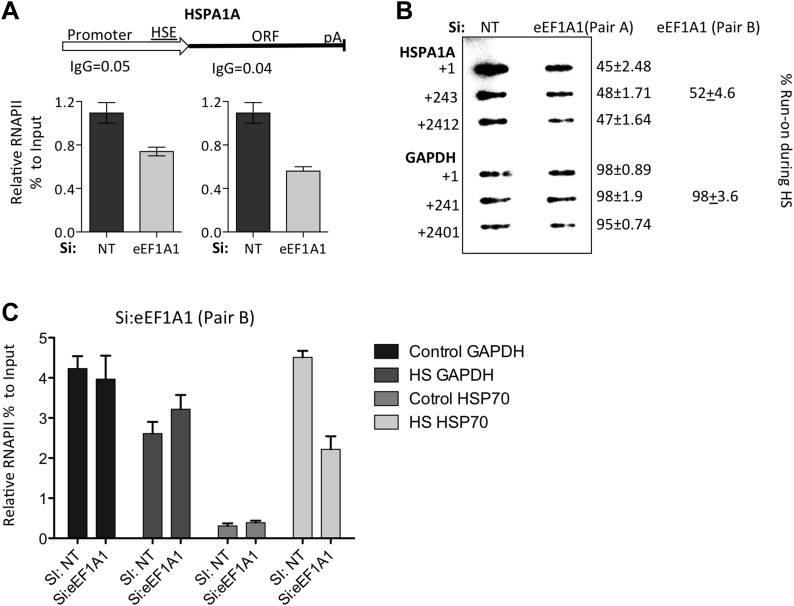
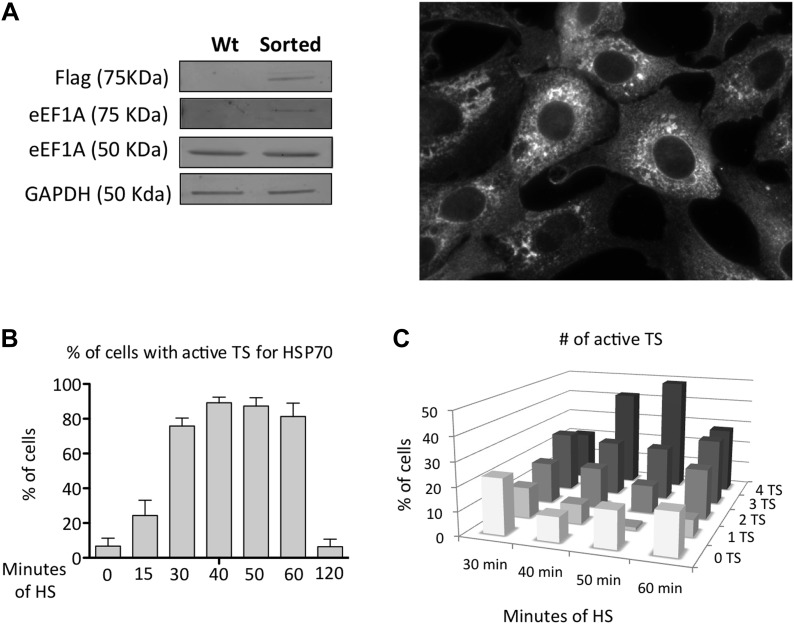
Figure 1. eEF1A1 regulates HSP70 expression and thermotolerance.
(A) Knock down of eEF1A1 decreases HSP70 protein expression upon heat shock. Western blots of HSP70, eEF1A1, HSF1, and GAPDH from total cell lysates of MDA-MB231 cells transfected with siRNA (pair A) against eEF1A1 or HSF1, or mock-transfected (Si:NT with no target). Control (C)—unstressed cells kept at 37°C. Heat shock (HS)—cells kept for 1 hr at 43°C followed by 6 hr of recovery at 37°C. (B) HSF1- or eEF1A1-knocked down cells are less thermo-tolerant. Cell death was quantified by FACS analysis after propidium iodide staining. Thermotolerance was induced in mock-transfected (Si:NT) or eEF1A1/HSF1-depleted cells by two heat treatments (1 hr at 43°C, 12 hr at 37°C, and 1 hr at 45°C), followed by 12 hr of recovery. Data from three independent experiments are presented as the mean ± SEM. *p < 0.05. (C) Knock down of eEF1A1 decreases HSP70 mRNA expression during heat shock. Total RNA from heat shocked MDA-MB231 cells was reverse-transcribed with random hexamer primers followed by quantification of GAPDH and HSP70 mRNAs by QPCR. HSP70 mRNA values were normalized to that of GAPDH. Bars represent the amount of HSP70 mRNA in cells depleted of eEF1A1 relative to that obtained for mock-transfected cells (Si:NT). 1 is the value of HSP70 mRNA in Si:NT cells at 1 hr of heat shock. Data from three independent experiments are presented as the mean ± SEM. *p < 0.05. (D) eEF1A1 controls RNAPII occupancy at the HSP70 gene after stress as determined by ChIP-QPCR. Schematic of the HSPA1A locus is shown at the top. Arrowheads indicate the regions amplified by QPCR. Panels show the effect of eEF1A1 knock down (si:eEF1A1) on RNAPII occupancy relative to input Ct value under non-heat shock conditions (control) and after 30 min of heat shock. The relative value for the IgG is indicated for each of the PCR fragments on top of the plot. Values below that of the IgG mean non-specific binding. Mock-transfected cells (Si:NT). By comparison, GAPDH showed no change with si;eEF1A1. Data from three independent experiments are presented as the mean ± SEM. (*p < 0.05). (E) eEF1A1 mediates HSP70 transcription upon HS. MEFs were infected with a lentivirus expressing Cherry-eEF1A1. eEF1A1 expression was knocked down by siRNA. At 30 min after HS, cells were fixed and HSP70 mRNA detected by FISH. Nuclei were stained with DAPI. Merged images show Cherry-eEF1A1 in red, HSP70 TS in gray and nucleus in blue. White arrows indicate cells knocked down of eEF1A1. Bar = 10 microns. (F) eEF1A1 mediates HSP70 transcription upon HS. Plots are the quantification of the intensity of HSP70 transcription, per cell or per TS, detected by FISH and quantified by airlocalize. A total of seventy cells per condition were analyzed from three independent experiments. NT = non-transfected cells. eEF1A1 = cells transfected with siRNA for eEF1A1.

