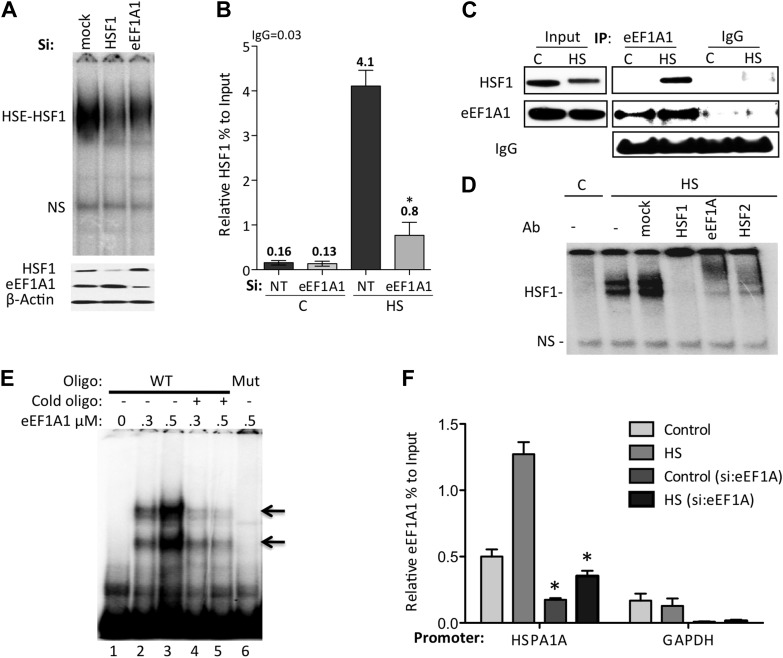
Figure 2. eEF1A1 mediates HSF1 recruitment to HSP70 promoter.
(A) eEF1A1 enhances HSF1 DNA binding upon heat shock. Mock-transfected, eEF1A1 or HSF1-knocked down MDA-MB231 cells were heat-shocked for 30 min at 43°C and analyzed by HSF1-HSE EMSA (top panel). 10 μg of total protein were loaded in the EMSA. HSF1, eEF1A1, and GAPDH levels were determined by immunoblotting (lower panel). (B) eEF1A1 is required for HSF1 promoter binding in vivo. ChIP-QPCR was performed on mock-transfected (Si:NT) or eEF1A1-knocked down (Si:eEF1A1) cells. Panel shows the effect of eEF1A1 depletion on HSF1 occupancy at the HSP70 promoter (relative to the input Ct value) under non-heat shock conditions (C) and after 30 min of heat shock (HS). The reference value for IgG control is indicated on top of the plot. Values below those numbers mean non-specific binding. Data from three independent experiments are represented as the mean ± SEM. (*p < 0.05). (C) Stress-induced formation of the eEF1A1-HSF1 complex in vivo. Extracts from unstressed (C) or heat-shocked (HS) MDA-MB231 cells IPed with eEF1A1 antibody or IgG. IP samples or total protein (Input) were subjected to SDS-PAGE and immunoblotting. (D) eEF1A1-HSF1 complex formation at HSE. Panels show the super-shift of HSF1-HSE EMSA caused by specified antibodies. MDA-MB231 cells were heat-shocked for 20 min at 43°C (HS). Extracts were incubated with antibodies to HSF1, HSF2 (positive control), or eEF1A1 antibodies, or IgG (mock). HSE-HSF1 indicates specific binding of HSF1 to labeled HSE; NS—a non-specific band. (E) Direct binding of eEF1A1 to HSP70 promoter DNA. Radiolabeled fragment of the region −141 to −91 of the human HSP70 promoter was incubated with purified eEF1A1 (lanes 1–3), chased with fivefold molar excess of cold oligonucleotide (lanes 4 and 5), or mutant fragment of the same region (lane 6). Arrows mark the specific eEF1A1 shift. (F) eEF1A1 binds the HSP70 promoter before and after stress. Mock transfected or eEF1A1-knocked down (Si:eEF1A) MDA-MB231 cells were kept at 37°C or heat-shocked (HS) for 20 min at 43°C. Chromatin IP with eEF1A1 or IgG antibodies and amplified by PCR for the HSP70 (HSPA1A) and GAPDH promoters. Relative value of the control IgG vs input for HSPA1A is 0.04 and for GAPDH is 0.05. Data from three independent experiments are presented as the mean ± SEM. *p < 0.05.


