. 2014 Sep 16;3:e03164. doi: 10.7554/eLife.03164

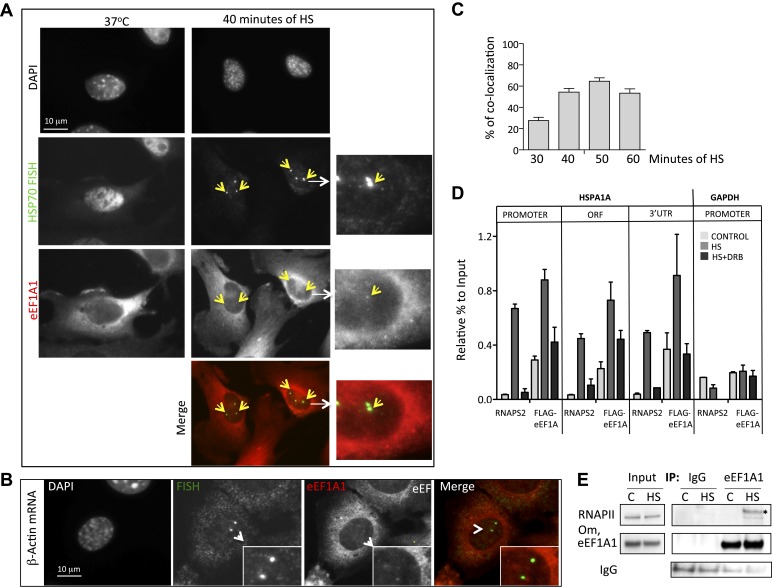
Figure 3. eEF1A1 localizes at HSP70 TS and interacts with RNAPII upon HS.

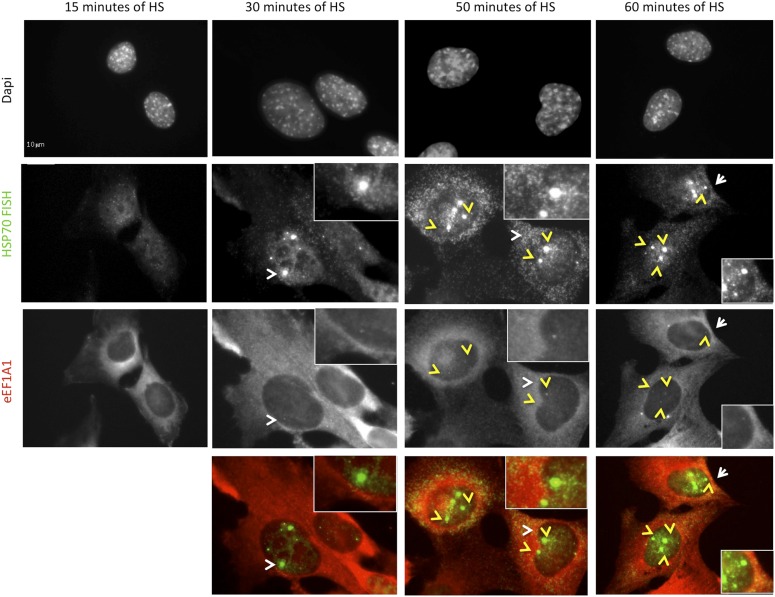
(A) eEF1A1 localizes to HSP70 TS upon HS. MEFs were infected with a lentivirus expressing Cherry-eEF1A1. At the indicated times after HS, cells were fixed and HSP70 mRNA detected by FISH. Nucleus stained with DAPI. Merged images show HSP70 FISH in green and cherry-eEF1A1 in red. The nascent mRNA signal is much brighter than the Cherry-eEF1A1 because there were many nascent chains each detected with 48 probes (48 fluors), compared to a single fluorescent protein for eEF1A1, further diminished by fixation. Yellow arrows indicate TS for HSP70 where Cherry-eEF1A1 was also detected. Inset location indicated by white arrowheads. n = total number of cells analyzed from three independent experiments. (%) = percentage of TS with co-localization for eEF1A1. Bar = 10 microns. (B) eEF1A1 localizes in nuclear dots. MEFs were infected with a lentivirus expressing Cherry-eEF1A1. At 1 hr of HS cells were fixed and FISH was carried out to detect β-actin mRNA. Nucleus DAPI stained. Merged images show HSP70 FISH in green and Cherry-eEF1A1 in red. Arrowhead = inset location. Note that nuclear localization of Cherry-eEF1A1 does not coincide with the β-actin mRNA TS. (C) Quantification of co-localization between eEF1A1 and HSP70 TS. Percentages of co-localization were quantified by airlocalize software at the indicated HS times. Average of three different experiments. Total n = (80–90) cells per time point. (D) DRB decreases RNAPIIS2 and eEF1A1 occupancy within the HSP70 gene in HS cells. Data are the mean ± SEM from three independent experiments. MEF cells expressing eEF1A1 tagged with Cherry and Flag were kept under normal growth conditions (control) or heat-shocked for 40 min at 43°C (HS) or treated with 100 µM DRB for 15 min followed by HS (HS+DRB). ChIP was performed using antibodies for RNAPII phosphorylated at Ser2 (RNAPS2) and Flag eEF1A1 followed by QPCR with the indicated primers. (E) eEF1A1 binds RNAPII during heat shock. Extracts from unstressed (C) or heat-shocked (HS) MDA-MB231 cells were IP with an eEF1A1 antibody or IgG (mock). IP samples or total protein (Input) were subjected to SDS-PAGE and immunoblotting with RNAPII and eEF1A1 antibodies. (*) Indicates the hyperphosphorylated form of RNAPII.

DOI: http://dx.doi.org/10.7554/eLife.03164.012

Figure 3.

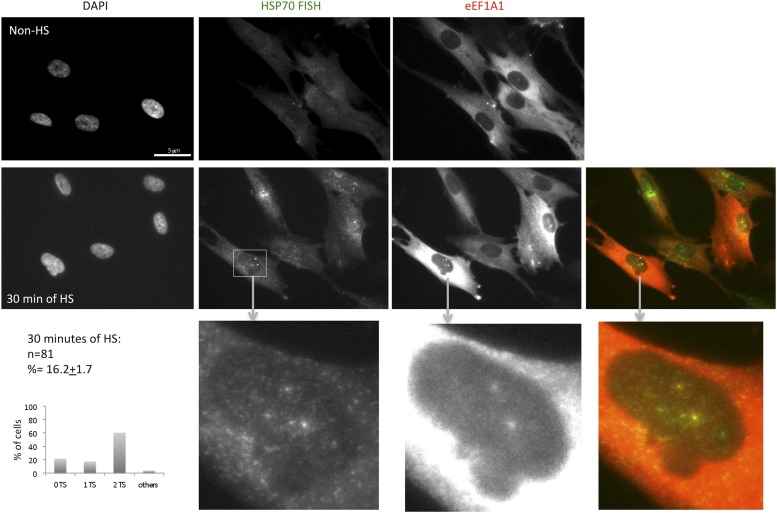
Figure 3—figure supplement 1. eEF1A1 localizes to HSP70 TS in the human fibroblast cell line TIG.

Figure 3—figure supplement 1.

eEF1A1 localizes to HSP70 TS upon HS. TIGs (human fibroblast cell line) cells were infected with a lentivirus that expresses Cherry-eEF1A1. After 30 min of HS cells were fixed and subjected to FISH to the HSP70 mRNA. Nucleus stained with DAPI. Merged images show HSP70 FISH in green and cherry-eEF1A1 in red. Yellow arrows indicate TS for HSP70 where cherry-eEF1A1 was also detected. Inset location indicated by white arrowheads. n = total number of cells analyzed from three independent experiments. (%) = percentage of TS with colocalization for eEF1A1. Bar = 10 microns.
Figure 3—figure supplement 2. eEF1A1 localizes to HSP70 TS upon HS.

Figure 3—figure supplement 2.

MEFs were infected with a lentivirus expressing Cherry-eEF1A1. At the indicated times after HS cells were fixed and HSP70 mRNA detected by FISH. Nucleus stained with DAPI. Merged images show HSP70 FISH in green and cherry-eEF1A1 in red. Yellow arrows indicate TS for HSP70 where cherry-eEF1A1 was also detected. Inset location indicated by white arrowheads. n = total number of cells analyzed from three independent experiments. (%) = percentage of TS with colocalization for eEF1A1. Bar = 10 microns.
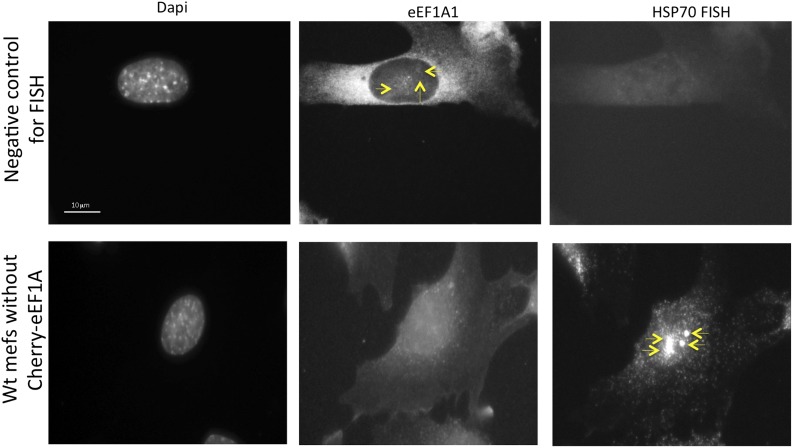
Figure 3—figure supplement 3. eEF1A1 localizes to HSP70 TS upon HS-negative controls.

Figure 3—figure supplement 3.

The upper panels show immortalized MEFs expressing Cherry-eEF1A1 treated for FISH without adding any probe. Cells were heated for 40 min at 43°C before fixation. Nucleus stained with DAPI. Yellow arrows indicate dots of cherry-eEF1A accumulation in the nucleus. The lower panels show FISH for HSP70 mRNA in inmortalized MEFs non-expressing Cherry-eEF1A1. Cells were heated for 40 min at 43°C before fixation and FISH. Yellow arrows indicate HSP70 TS.
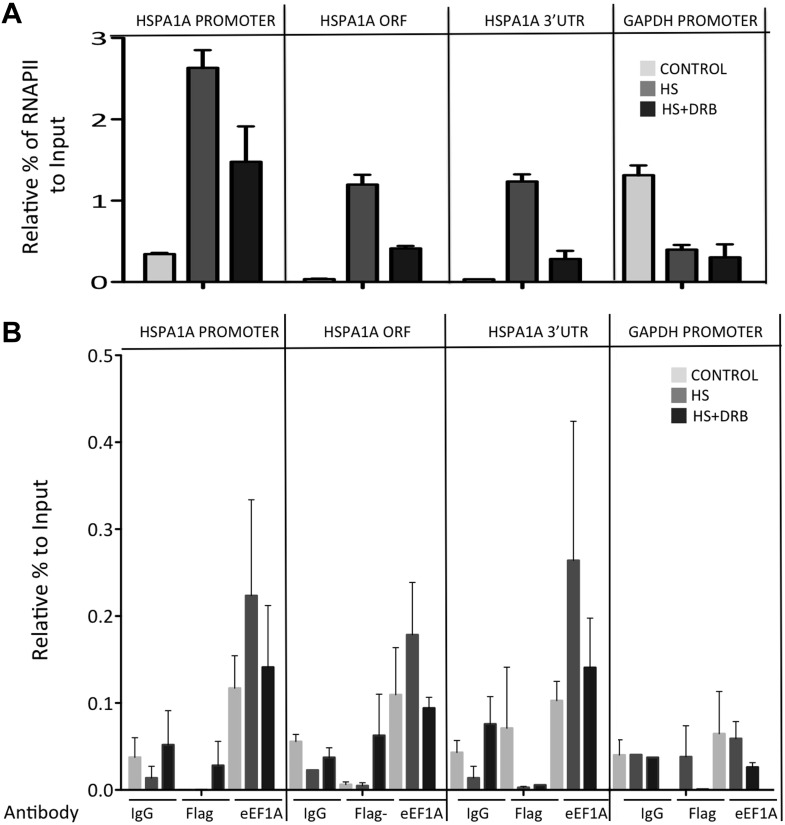
Figure 3—figure supplement 4. DRB decreases RNAPII and eEF1A1 occupancy within the HSP70 gene upon HS.

Figure 3—figure supplement 4.

(A). Data are the mean ± SEM from three independent experiments. MEF cells expressing eEF1A1 tagged with Cherry and Flag were kept under normal growth conditions (control) or heat-shocked for 40 min at 43°C (HS) or treated with 100 μM DRB for 15 min followed by HS (HS+DRB). ChIP was performed using antibodies for total RNAPII followed by QPCR with primers for the indicated regions. (B) DRB decreases eEF1A1 occupancy within the HSP70 gene upon HS. Data are the mean ± SEM from three independent experiments. Transformed MEFs were mock treated and kept under normal growth conditions (control) or heat-shocked for 40 min at 43°C (HS) or treated with 100 μM DRB for 15 min followed by HS (HS+DRB). ChIP was performed using antibodies for eEF1A1 and Flag (in Flag–cells) or IgG followed by QPCR with the indicated primers.