Figure 6.
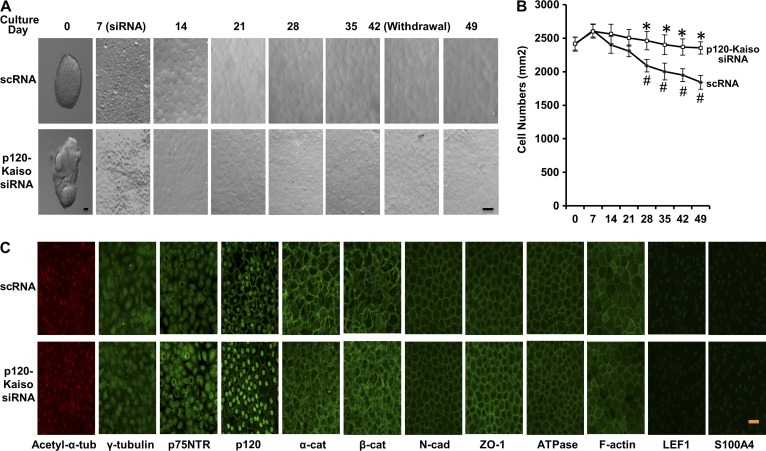
Maintenance of normal HCEC shape, density, and phenotype after withdrawal of p120-Kaiso siRNAs. (A and B) The morphology (A) and the density (B; *, P < 0.05 compared with the scRNA control; #, P < 0.05 compared with the in vivo density; n = 4) of HCEC monolayers were monitored throughout the entire period. Error bars indicate ±SEM. (C) Immunofluorescence staining to acetyl-α-tubulin (red) and other markers (all green) was performed in HCEC monolayers 1 wk after withdrawal. Bars, 25 µm.

