Fig. 5.
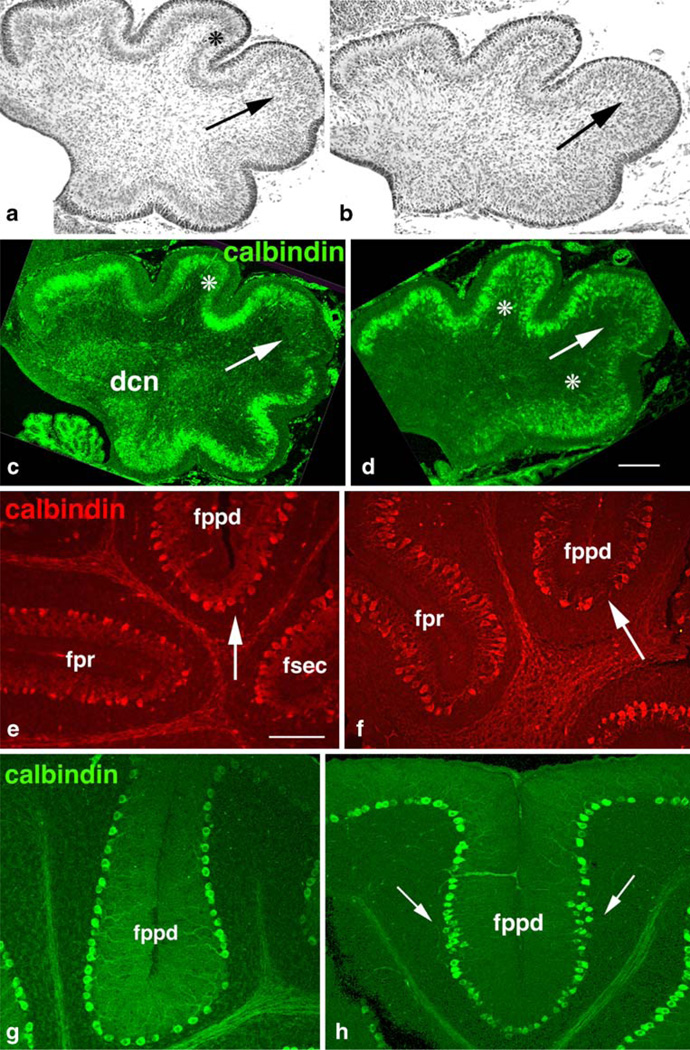
Purkinje cell maturation. a, b Nissl staining of midsagittal sections at P0 demonstrating coalescence of PCs into a monolayer at P0. GAP-43 (+/+) (a) and GAP-43 (−/−) (b). a Purkinje cells have begun coalescing into a monolayer (asterisk) except in the CeL (arrow). b Increased cell density in the CeL (arrow). c–h Calbindin expression by PCs. GAP-43 (+/+) (c, e, g) and GAP-43 (−/−) (d, f, h). c, d Midsagittal sections at P0. c PCs have begun to coalesce into a monolayer (asterisk) but are excluded from the CeL where the fppd is beginning to invaginate (arrow). d PC migration into the anterior and posterior lobes is inhibited (asterisks) and they invade the CeL (arrow). Scale bar=50 µm. e, f Expression of calbindin by PCs at P8. e PCs flanking primary (fpr) and secondary (fsec, fppd) fissures are elaborating extensive dendritic arbors (arrow). f GAP-43 (−/−) PCs flanking the secondary fppd have stunted dendrites (arrow) and are misaligned. Scale bar= 150 µm. g, h Expression of calbindin by PCs at P21. g PCs flanking the fppd form a mono-layer. h PCs flanking the fppd remain aggregated at the fissure flanks (arrows). Scale bar=100 µm

