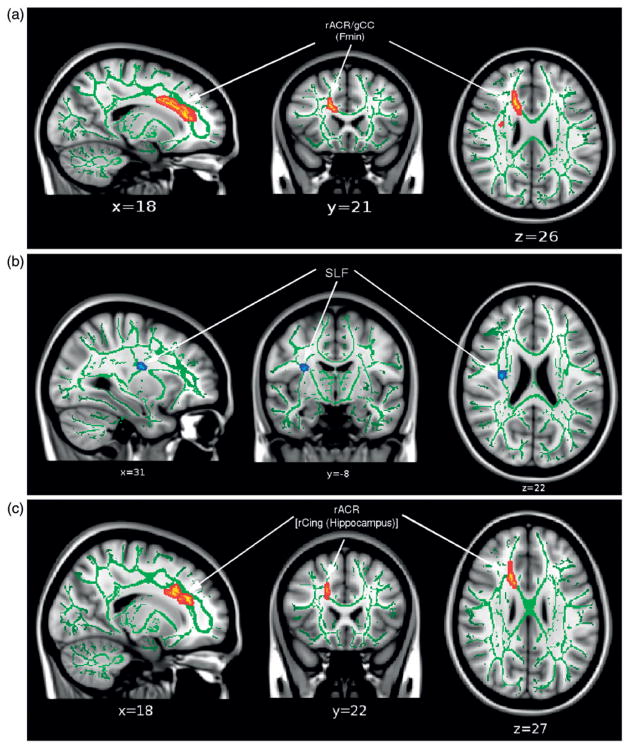
Figure 3.
Results of the TBSS regression analysis of FA with the WRAT-4 word reading subtest (p < 0.05, corrected) (i), RD with the DKEFS Tower Total Achievement Score (p < 0.05, corrected) (ii), and AD with the WISC-IV PSI score (p < 0.1, corrected) (iii) in the TBI group (positive correlation: red, negative correlation: blue). The significantly correlated regions were ‘‘thickened’’ to enhance visualization. The results are overlaid onto the MNI152 T1 template and the white matter tract skeleton is shown in green. The p-values are thresholded at p < 0.05 corrected over voxels that were reported as significant for AD (TBI > CTL) (see Figure 1).

