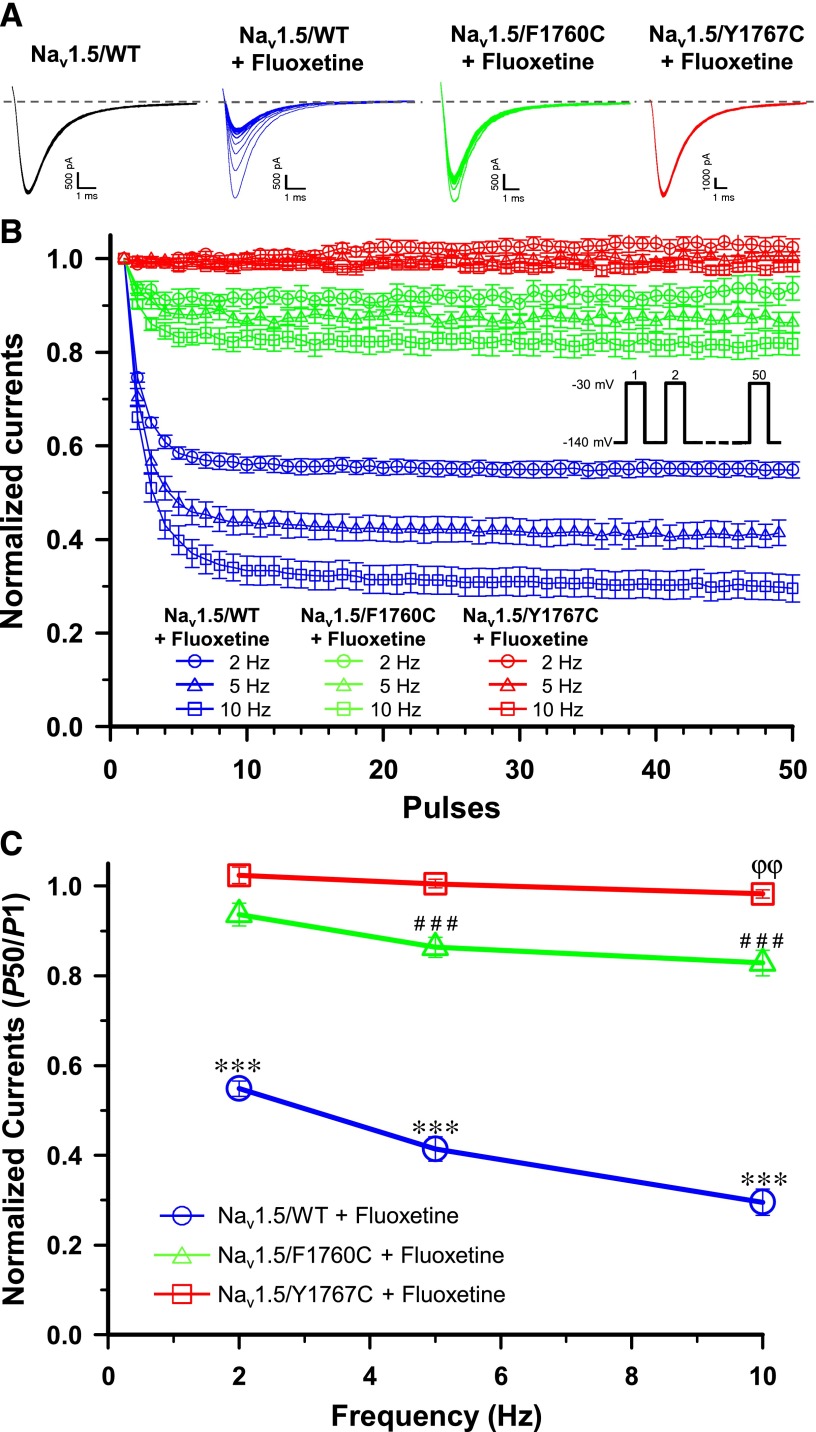
Fig. 3.
Frequency-dependent inhibition. (A) Representative whole-cell traces recorded from Nav1.5/WT (±30 µM fluoxetine), Nav1.5/F1760C (+30 µM fluoxetine), and Nav1.5/Y1767C (+ 30 µM fluoxetine) when pulsing at 10 Hz. The dashed line represents zero current. (B) Use-dependent blocks of Nav1.5/WT, Nav1.5/F1760C, and Nav1.5/Y1767C currents in the presence of 30 µM fluoxetine. A 50-pulse train was applied at −30 mV for 10 milliseconds from a holding potential of −140 mV when pulsing at 2 Hz, 5 Hz, and 10 Hz. Peak currents were measured, normalized to the peak amplitude at P1, and plotted against the corresponding pules. (C) Relative currents amplitudes (P50/P1) of the 50th sweep recorded from Nav1.5/WT, Nav1.5/F1760C, and Nav1.5/Y1767C. After the fluoxetine treatment, Nav1.5/WT (n = 8) currents were significantly reduced by 44, 58, and 67% compared with the control when pulsing at 2, 5, and 10 Hz, respectively (***P < 0.001). Fluoxetine significantly reduced Nav1.5/F1760C (n = 11) currents by 15 and 20% when pulsing at 5 and 10 Hz (###P < 0.001), respectively, and Nav1.5/Y1767C (n = 6) currents by 5% when pulsing at 10 Hz (ϕϕP < 0.01) compared with control. There was no significant use-dependent inhibition of Nav1.5/WT (n = 7), Nav1.5/F1760C (n = 5), or Nav1.5/Y1767C (n = 6) currents before the fluoxetine treatment. The controls curves of Nav1.5/WT, Nav1.5/F1760C, and Nav1.5/Y1767C without fluoxetine treatment were removed from the graphics for (B) and (C) for clarity.

