Fig. 4.
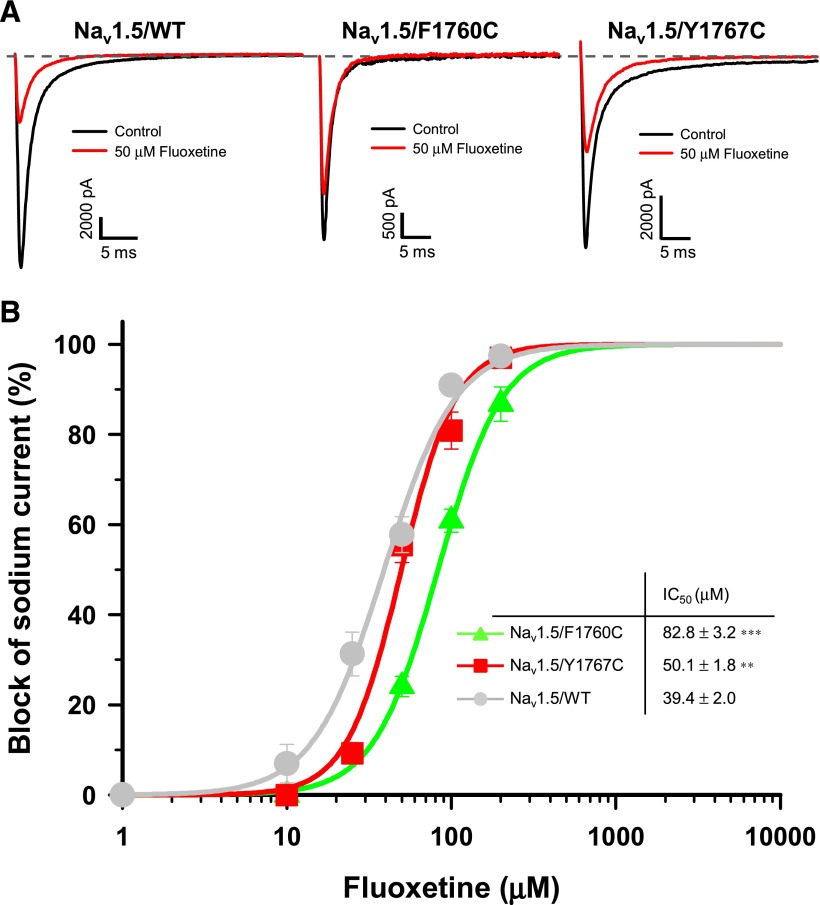
Tonic block of Nav1.5/F1760C and Nav1.5/Y1767C by fluoxetine. (A) Representative whole-cell traces recorded from Nav1.5/WT (left), Nav1.5/F1760C (middle), and Nav1.5/Y1767C (right) channels before and after the application of 50 μM fluoxetine. The dashed line represents zero current. (B) Dose-response curves of the inhibitory effect of racemic fluoxetine on Nav1.5/WT, Nav1.5/F1760C, and Nav1.5/Y1767C. The IC50 values of Nav1.5/F1760C (83 μM) and Nav1.5/Y1767C (50 μM) were significantly higher than Nav1.5/WT value (39 µM). **P < 0.01; ***P < 0.001. The different concentrations of drugs were applied using a perfusion system. Currents were elicited from a holding potential of −140 mV with a 50-millisecond test pulse at −30 mV delivered every 5 seconds. The inset in (B) shows the IC50 for each compound. Normalized current (INa) values were fitted to a Hill equation.

