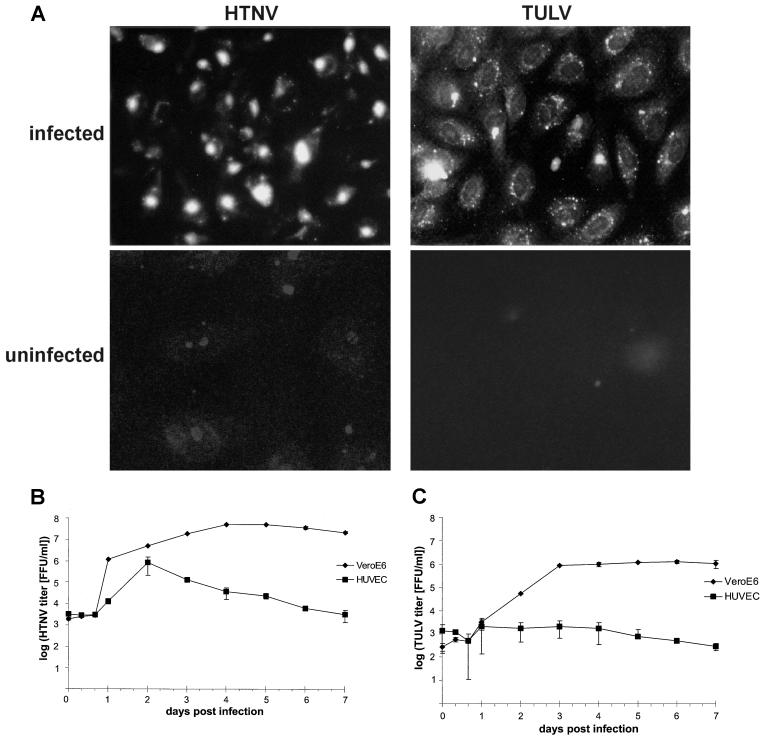
FIG. 1.
Detection of viral antigen and kinetics of virus production in HTNV- and TULV-infected cells. HUVECs or Vero E6 cells were infected (MOI, 1) with HTNV or TULV. (A) At 3 days postinfection, the distribution of viral antigen was visualized by immunocytochemistry in TULV-infected HUVECs by using a rabbit-derived polyclonal antiserum and in HTNV-infected HUVECs by using monoclonal antibody 1C12, specific for the hantavirus N protein. In both cases approximately 80 to 85% of cells stained positive. As a negative control, uninfected HUVECs were included in the analyses. Magnification, ×63. (B and C) Kinetics of virus production by HTNV-infected (B) and TULV-infected (C) HUVECs and Vero E6 cells are shown on a log scale. Supernatants of infected cells were collected at the time points indicated, and virus titers were determined by a chemiluminescence detection assay (13). Results are means ± standard errors of the means from three individual experiments with cells from three different donors (HUVECs) or from two individual experiments (Vero E6 cells).

