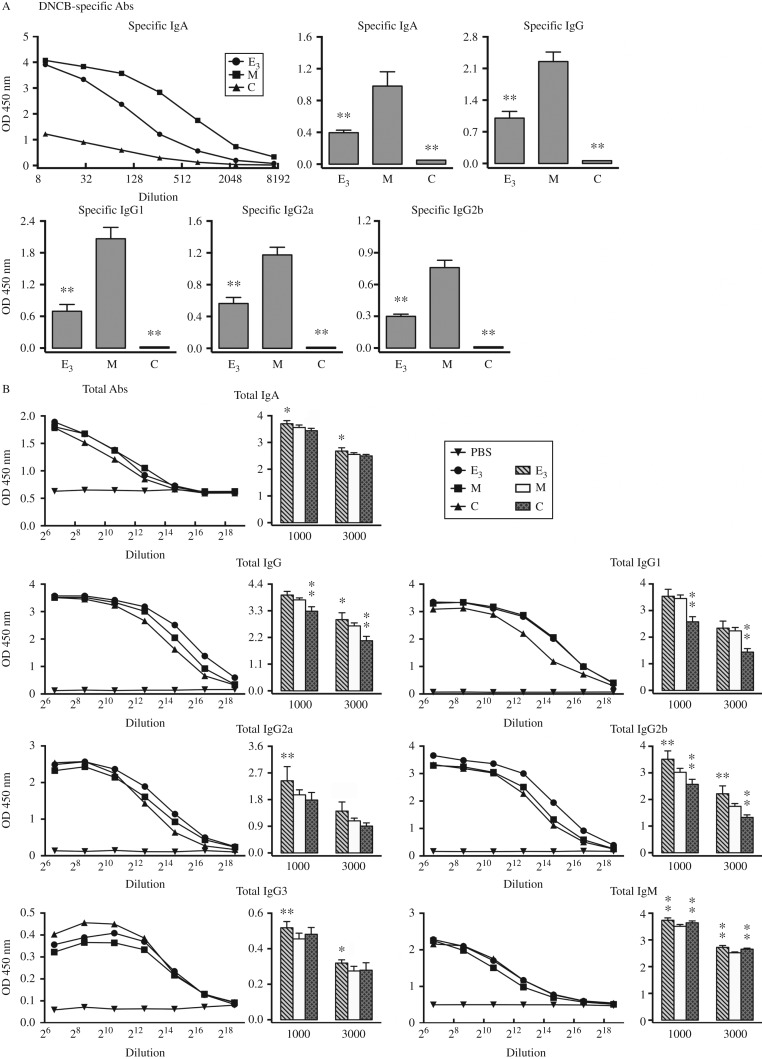
Figure 3.
Administration of E3 strongly suppresses DNCB-specific Abs in the sera of mice with DNCB-induced dermatitis. (A) Serum levels of DNCB-specific Abs on day 18 following DNCB treatment. Top left panel: serial dilution (1:10, 30, 90, 270, 810, 2430, and 7290) of DNCB-specific IgA. The average value from two mice in each group was shown. Top middle, right, and bottom panels: mean±s.d. showing serum levels of DNCB-specific IgA, IgG, IgG1, IgG2a, and IgG2b at 1:600 dilution. n=6 for each group *P<0.05; **P<0.01 vs the group of mice treated with DNCB alone ‘M’. (B) Serum levels of total Abs on day 18 following DNCB treatment. Line plots: average value of sera from two mice in each group showing the serial dilution (1:100, 400, 1600, 6400, 25 600, 102 400, and 409 600) of total IgA, IgG, IgG1, IgG2a, IgG2b, IgG3, and IgM. PBS was also diluted with assay buffer as negative control. Bar plots: mean±s.d. showing serum levels of total IgA, IgG, IgG1, IgG2a, IgG2b, IgG3, and IgM at the dilution of 1:1000 and 1:3000. Referred in Fig. 1 for the meaning of the group labels. n=6 for each group *P<0.05; **P<0.01 vs the group of mice treated with DNCB alone ‘M’.

 This work is licensed under a