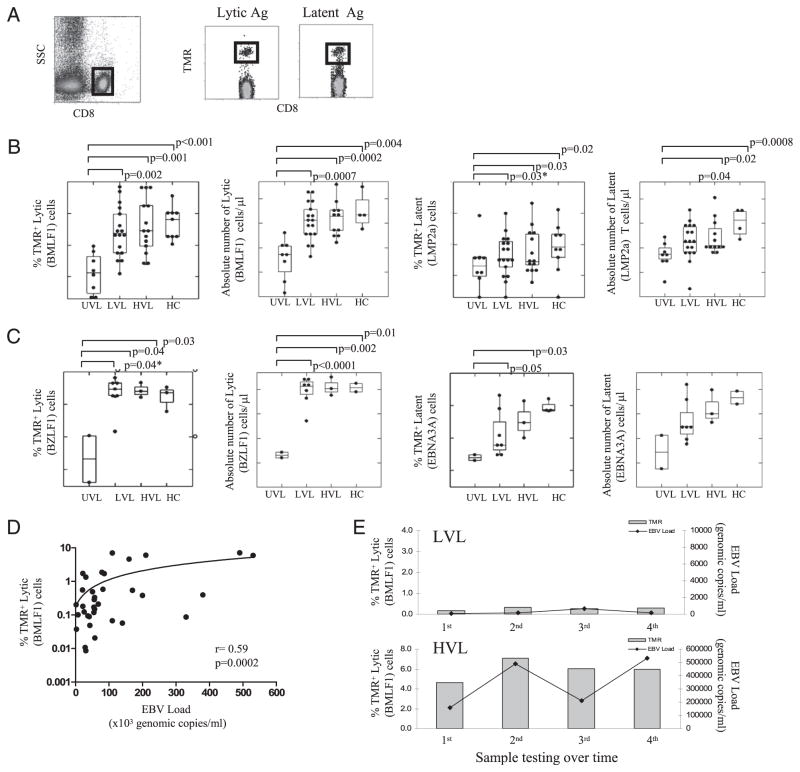
FIGURE 2.
Frequency of EBV-specific CD8+ T cells in peripheral blood. A, Gating strategy to identify the EBV (TMR)-specific CD8+ T cells in peripheral blood. B, Frequency (%) and absolute counts of HLA-A02–restricted, CD8+ T cells specific for lytic (BMLF1) and latent (LMP2a) epitopes. C, Frequency (%) and absolute counts of HLA-B08–restricted, CD8+ T cells specific for lytic (BZLF1) and latent (EBNA3A) epitopes. Data in B and C are represented as Tukey box plots, where the boxes indicate median and quartile values. Each dot represents the mean value of the frequencies of all EBV-specific CD8+ T cells determinations for a given subject. D, Correlation between EBV loads and the frequency of HLA-A02–restricted EBV lytic (BMLF1)-specific CD8+ T cells. Each dot represents the value obtained from one determination in one patient at a time. E, Follow-up analysis of the EBV load and the frequency of EBV-lytic (BMLF1)-specific CD8+ T cells in peripheral blood of representative HLA-A02+ LVL (top graph) and HVL (bottom graph) pediatric Tx patients. In each case, the measurements were performed at 6 mo intervals of each other. *p ≤ 0.05, one-tailed t test.

